AUD/USD catching a much-needed bid, recovering from 0.63

- The AUD/USD is seeing some lift on Monday, picking the pair up off the floor.
- It's been mostly down for the battered Aussie, which set a recent yearly low.
- Aussie traders will be on the lookout for the RBA's latest meeting minutes, due on Tuesday.
The AUD/USD could use all the help it can get, catching a minor bid into 0.6340 after testing 2023's lowest prices for the year last Friday.
Broader markets are stepping up the risk-appetite bids, moving away from the US Dollar (USD) and giving the Aussie (AUD) a chance to catch its breath.
The Reserve Bank of Australia (RBA) is broadly expected to hold steady on interest rates with the Aussie central bank firmly entrenched in wait-and-see territory. Inflation in the Australian domestic economy, while still high, has been easing steadily, and a wobbling economic outlook has the RBA firmly pushed off the rate lever.
The big barrier for Aussie bulls right now is US Retail Sales, also due on Tuesday. US Retail Sales are forecast to decline from 0.6% to 0.3% for September, and enough of a jiggle in either direction could send USD flows whipping.
Later this week Australia gets another crack at the economic calendar, with labor market data due at the tail end of the trading week, just before the Federal Reserve's Chairman Jerome Powell gives a speech.
AUD/USD Technical Outlook
The Aussie kicked off the trading week near 0.6295, and the AUD/USD has done nothing but lift since, sifting towards 0.6350 and aimed for a test into the 200-hour Simple Moving Average (SMA) near 0.6365, while a further breakdown below Friday's floor of 0.6286 will see the pair set to make a new low for the year.
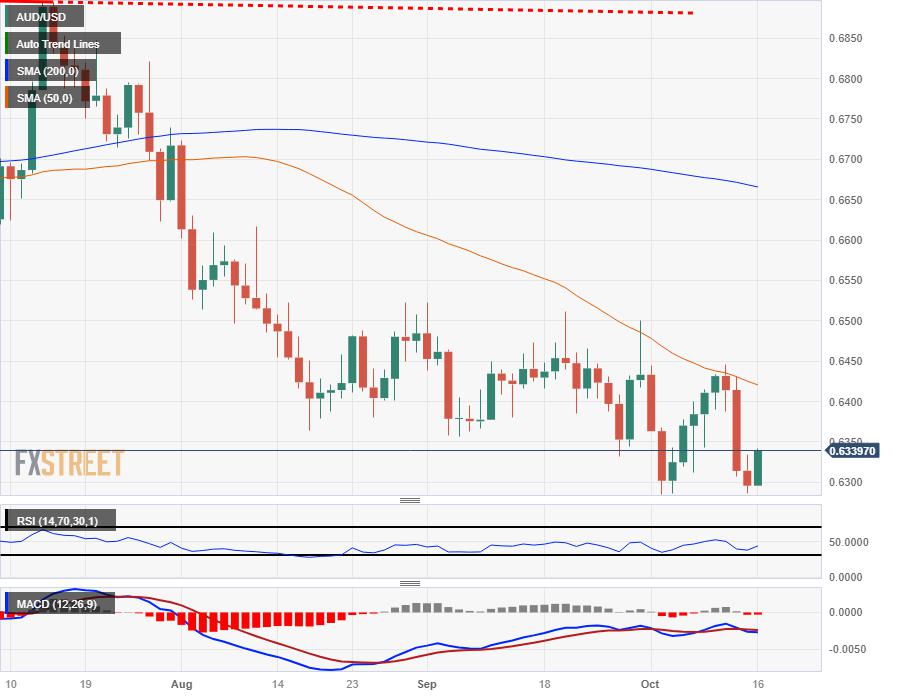
Daily candles have the Aussie buried deep into bear country, with the AUD/USD off the 0.640 handle and stuck near 2023's fresh lows of 0.6285 set in the first week of October. The last swing high into 0.6445 couldn't break free of the 50-day SMA and is marked in as the last level to beat before a bullish correction can even get off the ground.
AUD/USD Daily Chart
AUD/USD Technical Levels
Reprinted from FXStreet_id,the copyright all reserved by the original author.
Disclaimer: The content above represents only the views of the author or guest. It does not represent any views or positions of FOLLOWME and does not mean that FOLLOWME agrees with its statement or description, nor does it constitute any investment advice. For all actions taken by visitors based on information provided by the FOLLOWME community, the community does not assume any form of liability unless otherwise expressly promised in writing.
FOLLOWME Trading Community Website: https://www.followme.com


Hot
No comment on record. Start new comment.