NZD/USD Price Analysis: Extends losing spell to near 0.5900 on cautious market mood

- NZD/USD weakened further after China’s inflation remained stagnant in September.
- A minority of investors hope that the Fed will end up with an additional interest rate hike by the year-end.
- NZD/USD delivers a vertical sell-off after failing to break above the horizontal resistance plotted at 0.6050.
The NZD/USD pair continued its bearish spell for the third trading session as fears of a slowdown in China rose after a poor inflation report. The Kiwi asset has dropped to near 0.5900 as the appeal for the US Dollar improved after a stubborn United States inflation report and persistent deflation risks in China.
On early Friday, the National Bureau of Statistics of China reported that inflation remained stagnant in September while investors forecasted acceleration to 0.2% from the former reading of 0.1%. The monthly inflation data expanded at a slower pace of 0.2% from the consensus and August reading of 0.3%. Being, a proxy for China’s economic prospects, the New Zealand Dollar weakened due to poor demand in China’s domestic market.
The US Dollar Index (DXY) resumes upside after a corrective move to near 106.30 as a minority of investors hope that the Federal Reserve (Fed) would end up with an additional interest rate hike, pushing interest rates to 5.50-5.75 % by the year-end.
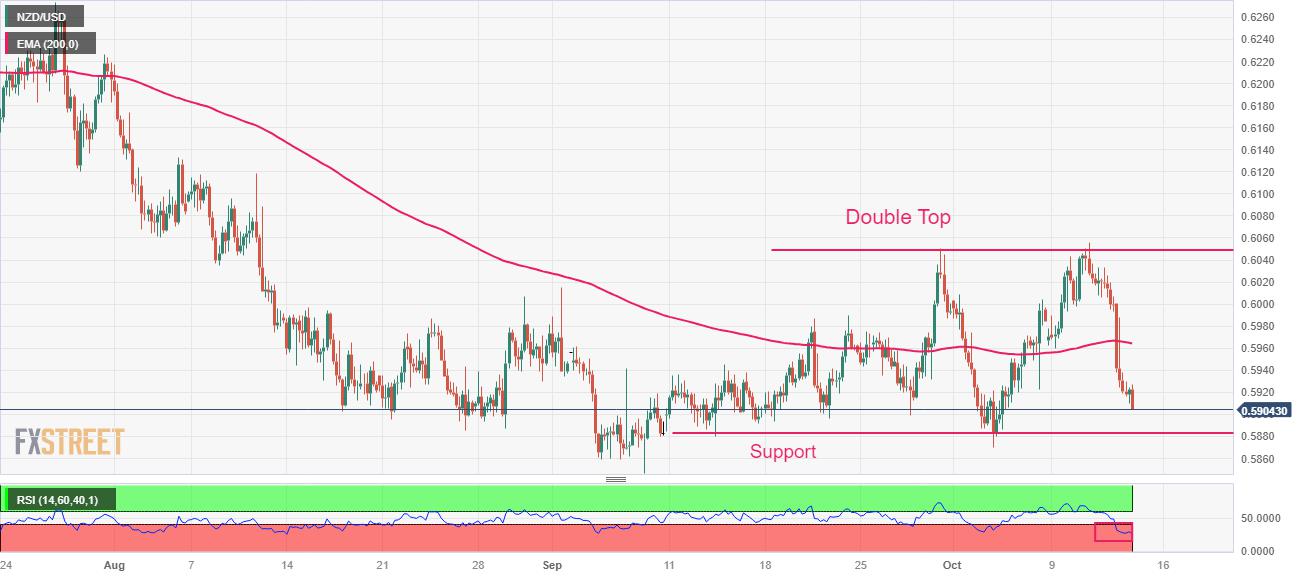
NZD/USD delivers a vertical sell-off after failing to break above the horizontal resistance plotted from September 29 high at 0.6050. The structure indicates a Double Top formation, which could be triggered after a breakdown below the crucial support of 0.5880.
The Kiwi asset trades below the 200-period Exponential Moving Average (EMA) at 0.5965, which indicates that the long-term trend is bearish.
A breakdown of the Relative Strength Index (RSI) (14) into the bearish range of 20.00-40.00 indicates that the bearish impulse has been triggered.
A breakdown below September 7 low at 0.5847 would drag the major toward the round-level support at 0.5800. A slippage below the latter would expose the asset to November 4 low at 0.5756.
On the flip side, a decisive break above September 29 high around 0.6050 would drive the major toward August 09 high at 0.6096. Breach of the latter would send the major toward July 31 high at 0.6226
NZD/USD four-hour chart
Reprinted from FXStreet_id,the copyright all reserved by the original author.
Disclaimer: The content above represents only the views of the author or guest. It does not represent any views or positions of FOLLOWME and does not mean that FOLLOWME agrees with its statement or description, nor does it constitute any investment advice. For all actions taken by visitors based on information provided by the FOLLOWME community, the community does not assume any form of liability unless otherwise expressly promised in writing.
FOLLOWME Trading Community Website: https://www.followme.com


Hot
No comment on record. Start new comment.