USD/JPY Price Analysis: Treads waters below 150.00, focus on US Consumer Sentiment

- USD/JPY faces a key barrier at 150.00 psychological level.
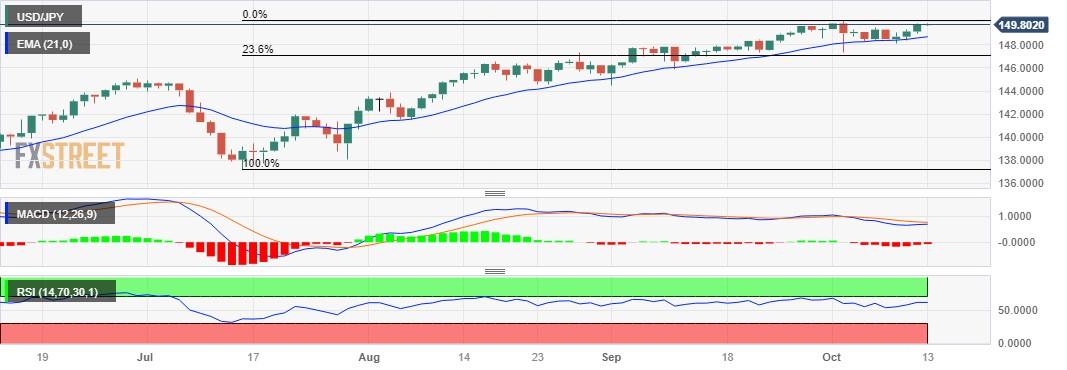
- MACD indicator suggests a momentum shift towards a bearish trend.
- The major level at 149.00 emerges as the support, followed by 21-day EMA.
USD/JPY aims to snap the three-day winning streak, trading around 149.80 during the Asian session on Friday, aligned to the major support level at 150.00. The pair received upward support due to the slew of upbeat economic data from the United States (US).
A decisive break above the level could contribute to support for the pair to explore the area around the monthly high at 150.16, followed by the psychological level at 150.50.
On the downside, the USD/JPY pair could find support near the psychological level at 149.00, followed by the 21-day Exponential Moving Average (EMA) at 148.71.
A firm break below the level could put pressure on the pair to navigate the region around the 148.00 level following the 23.6% Fibonacci retracement at the 147.11 level.
The technical analysis for the USD/JPY pair reveals an interesting dynamic. The Moving Average Convergence Divergence (MACD) line being above the centerline indicates a short-term average above the long-term average. However, a significant development is observed as the line is positioned below the signal line, suggesting a shift in momentum toward a bearish trend.
However, the USD/JPY pair maintains a prevailing bullish momentum, highlighting a stronger bias. This is evident in the 14-day Relative Strength Index (RSI) holding above the 50 level, suggesting that the pair has a persistent strength and is still in bullish territory.
USD/JPY: Daily Chart
Reprinted from FXStreet_id,the copyright all reserved by the original author.
Disclaimer: The content above represents only the views of the author or guest. It does not represent any views or positions of FOLLOWME and does not mean that FOLLOWME agrees with its statement or description, nor does it constitute any investment advice. For all actions taken by visitors based on information provided by the FOLLOWME community, the community does not assume any form of liability unless otherwise expressly promised in writing.
FOLLOWME Trading Community Website: https://www.followme.com


Hot
No comment on record. Start new comment.