USD/CHF jumps after US inflation figures, hawkish bets on the Fed rise

- USD/CHF increased to ahigh near 0.9070, up by more than 0.40%.
- US CPI from September came in higher than expected at 3.7% YoY.
- US yields recovered traction, and the US Dollar is finding demand.
In Thursday’s session, the USD/CHF traded with gains after six consecutive days of losses. Rising US Treasury yields amid a hot Consumer Price Index (CPI) reading from the US from September helped the green currency to find demand and hawkish bets on the Federal Reserve (Fed) rose. On the Swiss side, nothing relevant was released during the European session.
The US Bureau of Census Analysis reported that the September US Consumer Price Index (CPI) came in at 3.7% YoY, higher than the expected 3.6% but matched the previous monthly figure. The Core measure didn’t show any surprise and decelerated to 4.1%.
As a reaction, US bond yields are rising across the board. The 2-year rate rose to 5.07%, up by more than 1.50%, while the 5 and 10-year rates soared to 4.64% and 4.66%, respectively, with both advancing by nearly 2%. In that sense, they reflect that the markets are betting on a more aggressive Fed, and the World Interest Rate Possibilities (WIRP) tool indicates that the odds of a 25 bps hike by the Federal Reserve (Fed) have significantly risen and stand around 50%.
As expected, high-tier data, like inflation readings, will generate hawkish bets to rise and fall until the following November meeting by the Fed. The next data points to consider include the University of Michigan Consumer Sentinment index and Inflation expectations on Friday and Retail Sales figures from September next week.
USD/CHF Levels to watch
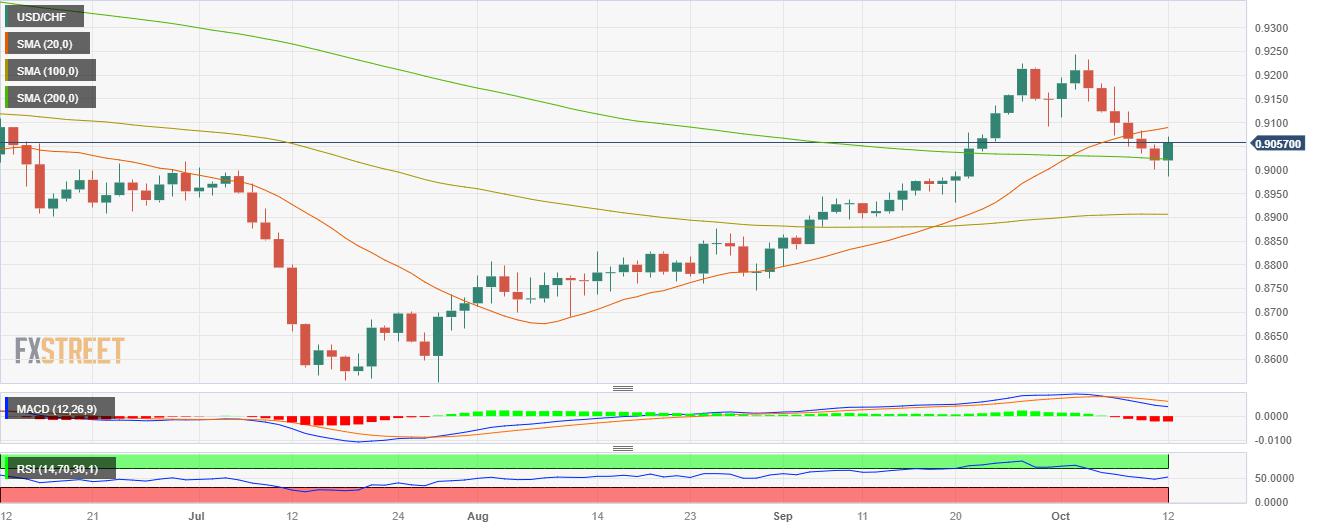
Observing the daily chart, the outlook is starting to tilt in favour of the bears but they still have some work to do. The Relative Strength Index (RSI) shows an ascending slope above its midline, while the Moving Average Convergence (MACD) prints stagnant red bars. On the other hand, the pair is below the 20-day Simple Moving Average (SMA) but above the 100 and 200-day SMAs, pointing towards the prevailing strength of the bulls in the larger context but in the meantime, the bears may gain additional ground.
Support levels: 0.9020 (200-day SMA), 0.9000, 0.8985.
Resistance levels: 0.9090 (20-day SMA), 0.9130, 0.9150.
USD/CHF Daily Chart
Reprinted from FXStreet_id,the copyright all reserved by the original author.
Disclaimer: The content above represents only the views of the author or guest. It does not represent any views or positions of FOLLOWME and does not mean that FOLLOWME agrees with its statement or description, nor does it constitute any investment advice. For all actions taken by visitors based on information provided by the FOLLOWME community, the community does not assume any form of liability unless otherwise expressly promised in writing.
FOLLOWME Trading Community Website: https://www.followme.com


Hot
No comment on record. Start new comment.