USD Index Price Analysis: A deeper decline could extend to 104.40

- DXY keeps the bearish performance unchanged on Wednesday.
- Extra retracement could force the index to revisit the 104.40 region.
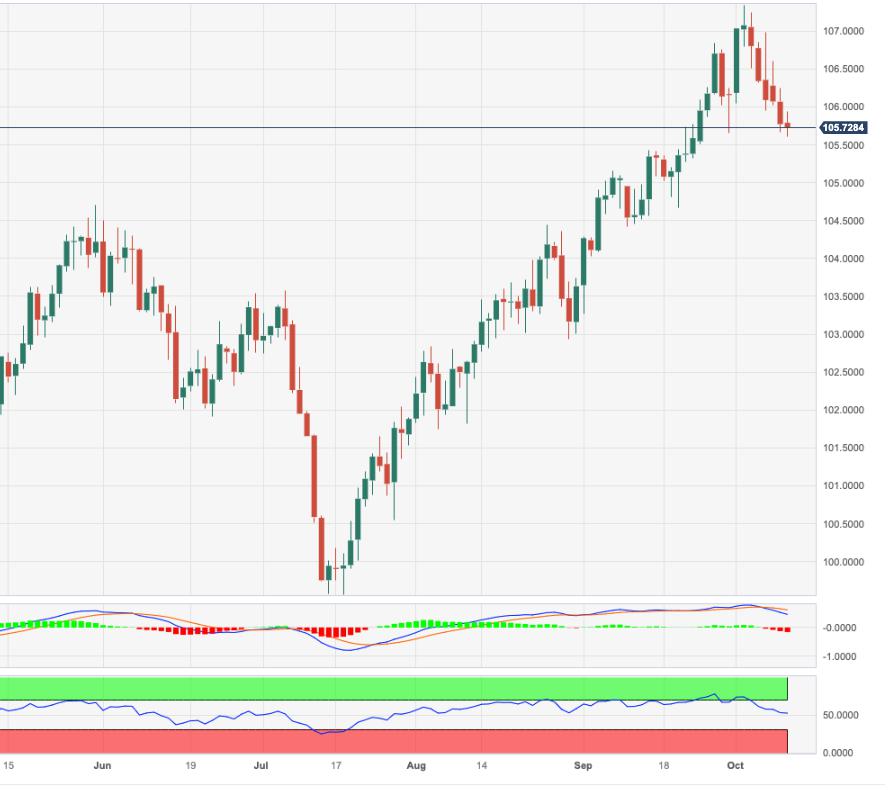
The continuation of the sell-off drags DXY to the area of two-week lows around 105.60 on Wednesday.
In case bears push harder, then index could then slip back to the weekly low of 104.42 (September 11), which appears reinforced by the proximity of the interim 55-day SMA, today at 104.31.
In the meantime, while above the key 200-day SMA, today at 103.18, the outlook for the index is expected to remain constructive.
DXY daily chart
Reprinted from FXStreet_id,the copyright all reserved by the original author.
Disclaimer: The content above represents only the views of the author or guest. It does not represent any views or positions of FOLLOWME and does not mean that FOLLOWME agrees with its statement or description, nor does it constitute any investment advice. For all actions taken by visitors based on information provided by the FOLLOWME community, the community does not assume any form of liability unless otherwise expressly promised in writing.
FOLLOWME Trading Community Website: https://www.followme.com


Hot
No comment on record. Start new comment.