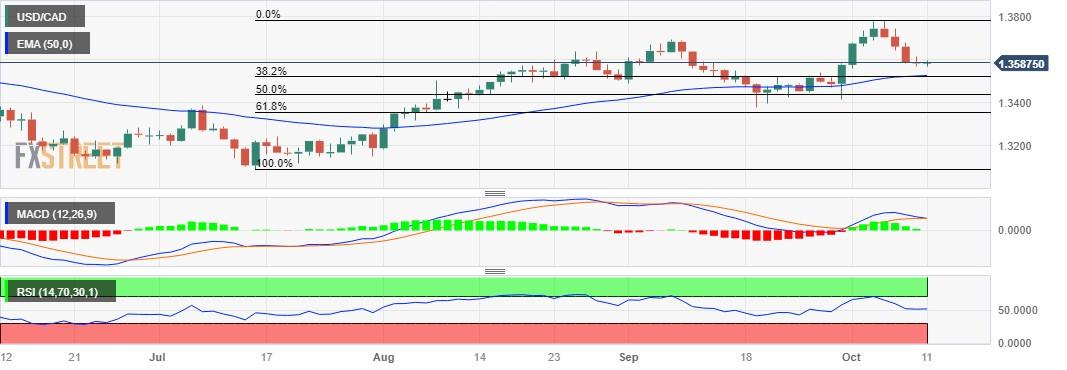
USD/CAD Price Analysis: Hovers below the 1.3600, technical suggests a trend reversal

- USD/CAD moves upward near the 1.3600 major level.
- MACD indicates a change in momentum towards a bearish trend.
- Resistance at 1.3650 psychological level, followed by the weekly high.
USD/CAD snaps the four-day losing streak, trading slightly higher around 1.3590 aligned with the immediate resistance at the 1.3600 psychological level during the Asian session on Wednesday. However, the pair faced challenges due to the higher oil prices.
A decisive break above the latter could contribute upward support for the pair to explore the area around the major level at 1.3650, following the next level around the weekly high at 1.3679.
On the flip side, the USD/CAD pair could meet the support near the major level at 1.3550, followed by the 50-day Exponential Moving Average (EMA) at 1.3527 aligned to the 38.2% Fibonacci retracement at 1.3520.
A firm break below the level could open the doors for the pair to navigate the region around the psychological level at 1.3500.
The Moving Average Convergence Divergence (MACD) line is above the centerline but intersects with the signal line, it might indicate a weakening trend. This scenario suggests a signal to be cautious and watch for further confirmation.
However, the prevailing bullish momentum in the USD/CAD pair indicates a strong bias, as the 14-day Relative Strength Index (RSI) remains above the 50 level.
USD/CAD: Daily Chart
Reprinted from FXStreet_id,the copyright all reserved by the original author.
Disclaimer: The content above represents only the views of the author or guest. It does not represent any views or positions of FOLLOWME and does not mean that FOLLOWME agrees with its statement or description, nor does it constitute any investment advice. For all actions taken by visitors based on information provided by the FOLLOWME community, the community does not assume any form of liability unless otherwise expressly promised in writing.
FOLLOWME Trading Community Website: https://www.followme.com


Hot
No comment on record. Start new comment.