GBP/JPY gains traction, bearish cross between the 100 and 20-day SMA looms

- GBP/JPY advanced near 182.50, up by 0.44%.
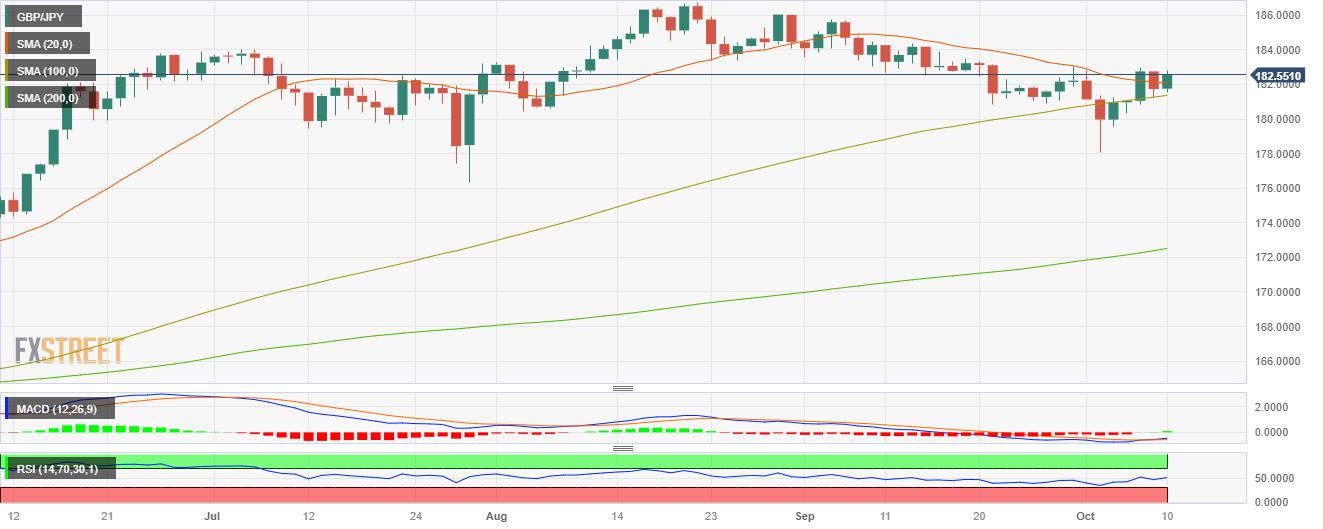
- The 100 and 20-day SMA are converging towards 181.50.
- Indicators on the daily chart suggest that bullish momentum is still weak.
In Tuesday's session, the GBP/JPY gained ground and jumped to 182.50, but the daily chart's bullish momentum appears weak.
In line with that, the GBP/JPY has a neutral to bearish technical stance, with the bears gradually recovering and asserting themselves. Despite the Relative Strength Index (RSI) maintaining a positive slope above its midline, bulls appear not to have the necessary momentum to continue climbing. In addition, the Moving Average Convergence (MACD) exhibits stagnant green bars. To add to that, the 20 and 100-day Simple Moving Average are converging towards the 181.50 area, and in case of completing the cross, the bears could gather momentum, usually typical when a short-term crosses below a longer-term moving average.
In that sense, support levels line up at the 181.50 area, followed by the 181.00 and 180.00 area. On the other hand, resistances are seen at 183.00, 183.50 and 184.00.
GBP/JPY Daily chart
Reprinted from FXStreet_id,the copyright all reserved by the original author.
Disclaimer: The content above represents only the views of the author or guest. It does not represent any views or positions of FOLLOWME and does not mean that FOLLOWME agrees with its statement or description, nor does it constitute any investment advice. For all actions taken by visitors based on information provided by the FOLLOWME community, the community does not assume any form of liability unless otherwise expressly promised in writing.
FOLLOWME Trading Community Website: https://www.followme.com


Hot
No comment on record. Start new comment.