NZD/USD Price Analysis: Remains below two-week high amid modest USD strength

- NZD/USD attracts some dip-buying on Tuesday, albeit lacks follow-through.
- A positive risk tone lends some support; resurgent USD demand caps gains.
- The technical setup supports prospects for a break through the 100-day SMA.
The NZD/USD pair reverses an intraday dip to levels just below the 0.6000 psychological mark and turns neutral during the first half of the European session. Spot prices currently trade around the 0.6020 area, unchanged for the day, and just below a nearly two-week high touched earlier this Tuesday.
A generally positive tone around the equity markets turns out to be a key factor lending some support to the risk-sensitive Kiwi. That said, the emergence of some US Dollar (USD) dip-buying, bolstered by bets for at least one more rate hike by the Federal Reserve (Fed), keeps a lid on any meaningful upside for the NZD/USD pair.
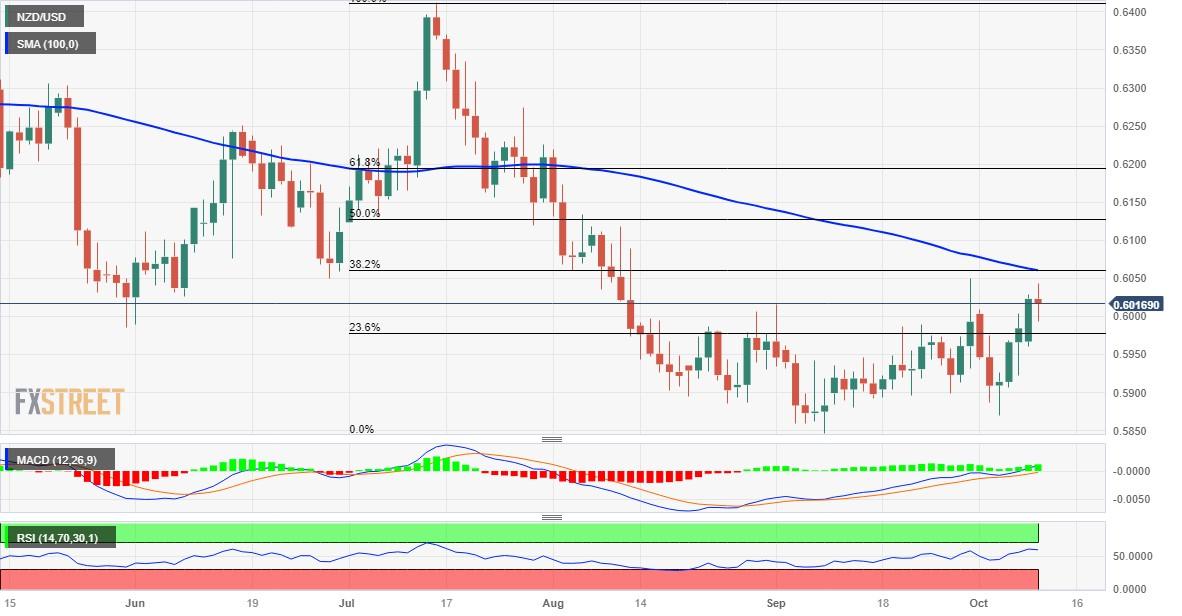
From a technical perspective, the 0.6050 area coincides with the September monthly swing high and is closely followed by the 100-day Simple Moving Average (SMA), around the 0.6060 region. The latter also represents the 38.2% Fibonacci retracement level of the July-August downfall and should now act as a key pivotal point.
A sustained strength beyond will be seen as a fresh trigger for bullish traders and pave the way for additional gains. With oscillators on the daily chart gaining positive traction, the NZD/USD pair might then aim towards reclaiming the 0.6100 mark and extend the momentum to the 0.6125-0.6130 region, or the 50% Fibo.
On the flip side, weakness below the 0.6000 mark is likely to find some support near the 23.6% Fibo. level, around the 0.5980-0.5975 region. A convincing break below could drag the NZD/USD pair back to the 0.5900 mark en route to last week's swing low, around the 0.5870 zone, which is followed by mid-0.5800s, or the YTD low.
NZD/USD daily chart
Technical levels to watch
Reprinted from FXStreet_id,the copyright all reserved by the original author.
Disclaimer: The content above represents only the views of the author or guest. It does not represent any views or positions of FOLLOWME and does not mean that FOLLOWME agrees with its statement or description, nor does it constitute any investment advice. For all actions taken by visitors based on information provided by the FOLLOWME community, the community does not assume any form of liability unless otherwise expressly promised in writing.
FOLLOWME Trading Community Website: https://www.followme.com


Hot
No comment on record. Start new comment.