GBP/USD Price Analysis: Remains flat above 1.2150, eyes on US Jobless Claims

- GBP/USD trades sideways around 1.2160 amid the USD softness.
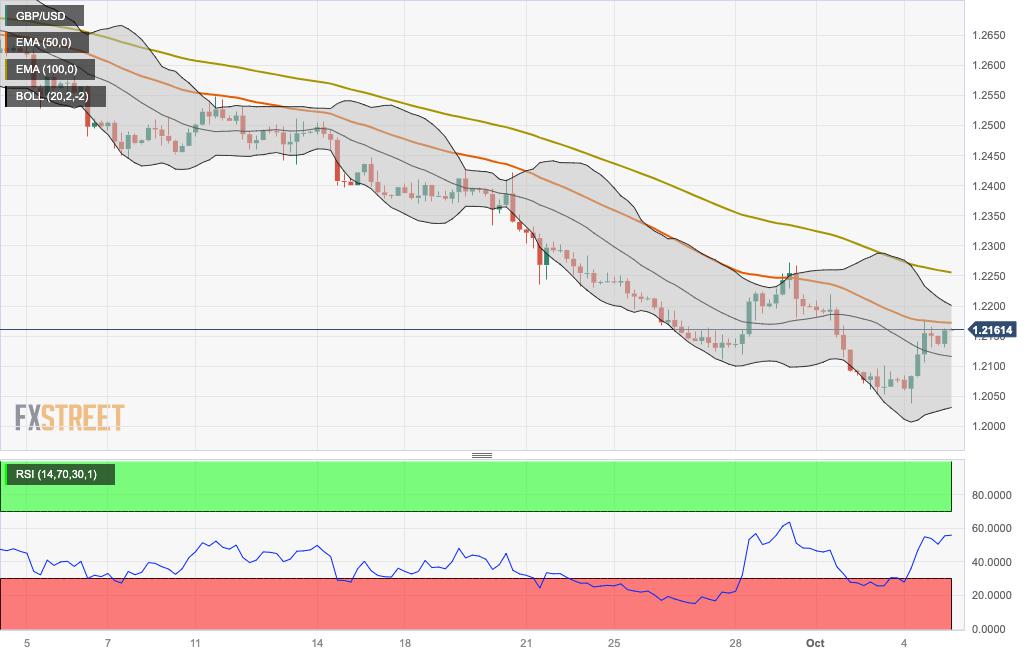
- The pair holds below the 50- and 100-hour EMAs; RSI is located above 50 in the bullish territory.
- The key resistance level will emerge at the 1.2200-1.2210 zone; the initial support level is located at 1.2110.
The GBP/USD pair remains flat above the mid-1.2100s during the Asian session on Thursday. In the absence of the top-tier economic data from the UK docket, the major pair remains at the mercy of the US Dollar (USD) price dynamics. GBP/USD currently trades near 1.2160, gaining 0.21% on the day.
That said, the rebound of the pair is supported by the weaker US Dollar (USD) following the softer US labor market data. Automatic Data Processing (ADP) reported on Thursday that the US private payrolls for September rose by 89,000 from the previous reading of 180,000, below the market expectation of 153,000. This figure posted the lowest level since January 2021.
Technically, GBP/USD holds below the 50- and 100-hour Exponential Moving Averages (EMAs) with a downward slope on the four-hour chart, which means further downside looks favorable. Furthermore, the Relative Strength Index (RSI) holds above 50 in the bullish territory, indicating that buyers are likely to retain control soon.
The critical resistance level for GBP/USD will emerge near the upper boundary of the Bollinger Band and a psychological round figure at the 1.2200-1.2210 region. The additional upside filter to watch is near the 100-hour EMA at 1.2257. The next barrier for the pair is seen at 1.2270 (a high of September 29). Further north, a high of September at 1.2324 will be the next stop.
On the other hand, the initial support level is located at 1.2110 (a low of September 27). The next contention level will emerge near a low of October 3, en route to the lower limit of the Bollinger Band at 1.2028. Any decisive follow-through selling below will see a drop to 1.1965 (a low of February 16).
GBP/USD four-hour chart
Reprinted from FXStreet_id,the copyright all reserved by the original author.
Disclaimer: The content above represents only the views of the author or guest. It does not represent any views or positions of FOLLOWME and does not mean that FOLLOWME agrees with its statement or description, nor does it constitute any investment advice. For all actions taken by visitors based on information provided by the FOLLOWME community, the community does not assume any form of liability unless otherwise expressly promised in writing.
FOLLOWME Trading Community Website: https://www.followme.com


Hot
No comment on record. Start new comment.