EUR/JPY Price Analysis: Navigates inside the Ichimoku cloud, consolidates at around 156.50s

- EUR/JPY trades cautiously, marking a slight 0.04% dip in the early Asian session, lingering near its Wednesday high within the Ichimoku Cloud.
- Key resistance levels to watch include the top of the Kumo at 156.98 and the psychological barrier at 157.00.
- Downward movement breaking below the Senkou-Span B at 155.58 could see the pair targeting the October 3 low of 154.34.
The EUR/JPY printed modest gains on Wednesday, but it remains trapped inside the Ichimoku Cloud (Kumo), set to remain neutrally biased unless it breaks above/below of the latter. Early in the Asian session, the EUR/JPY is trading at 156.54, down by 0.04%.
From a daily chart perspective, the EUR/JPY is trading near Wednesday’s high at around 156.50s, but to stage a comeback, the cross must break the top of the Kumo at 156.98, immediately followed by 157.00. the next resistance would be October 2, high at 158.47. Conversely, if the pair drops below the Senkou-Span B at 155.58, the path of least resistance would pave the way for further losses, with next support at the October 3 swing low of 154.34.
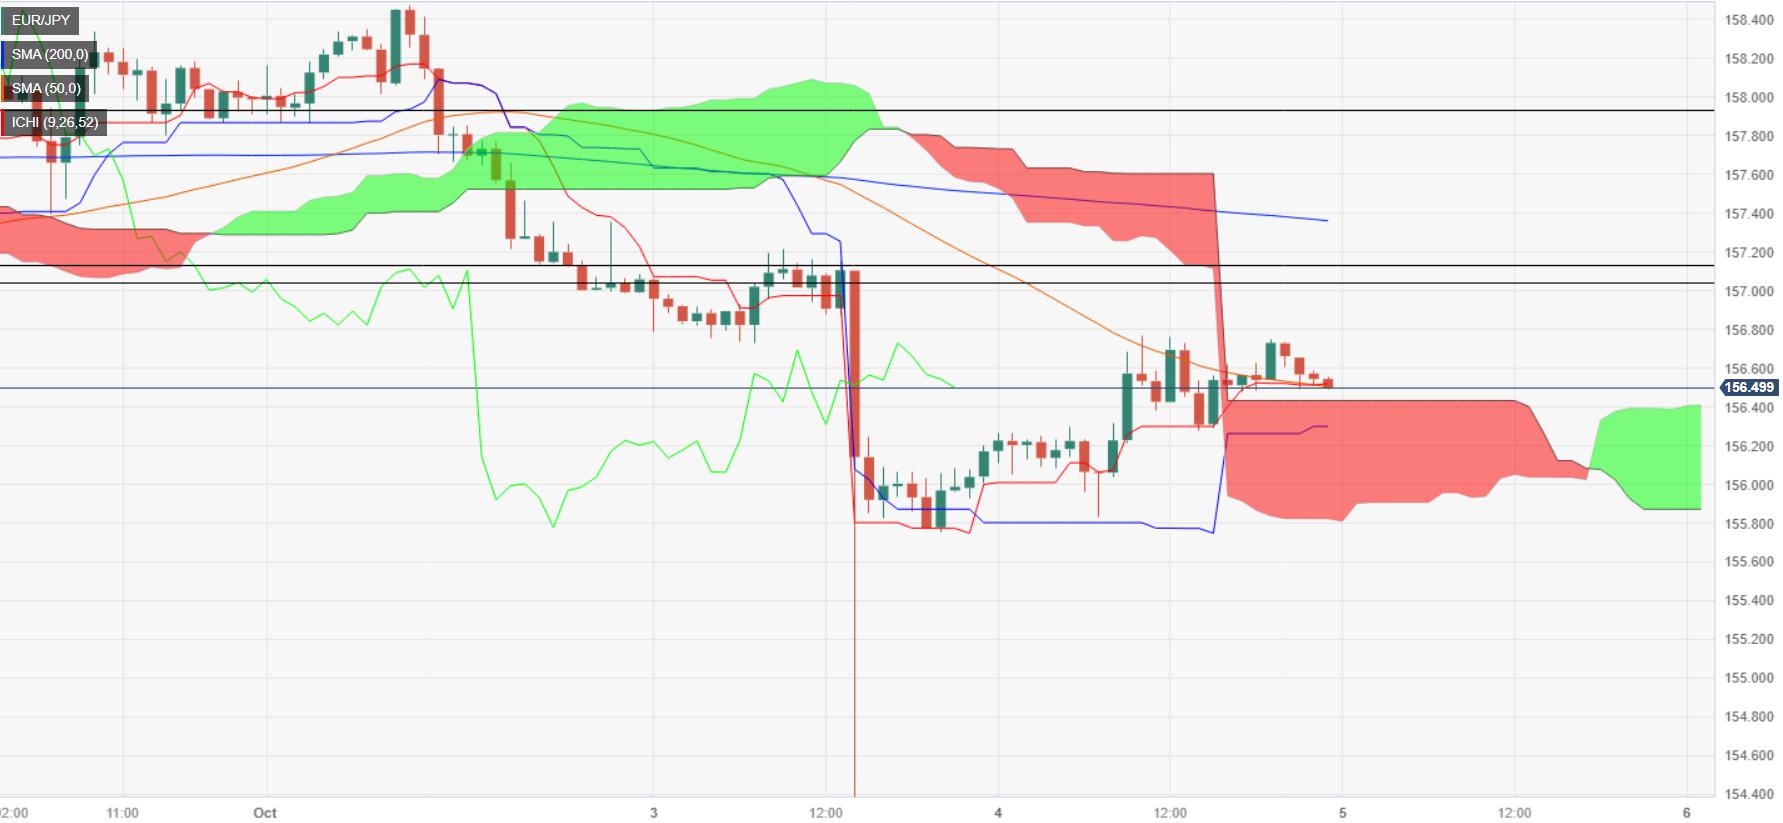
Short term, the EUR/JPY hourly chart displays the pair consolidating but tilted to the upside after breaking above the Kumo. Next, resistance emerges at the October 4 high at 156.76, followed by the psychological 157.00 figure. Conversely, if the cross-currency pair drops below the confluence of the Tenkan-Sen and Senkou Span A at 156.41, that would pave the way for further losses. The next support would be the Kijun-Sen at 156.29, then 156.00, and then the bottom of the Kumo at 155.80.
EUR/JPY Price Action – Hourly chart
EUR/JPY Key Technical Levels
Reprinted from FXStreet_id,the copyright all reserved by the original author.
Disclaimer: The content above represents only the views of the author or guest. It does not represent any views or positions of FOLLOWME and does not mean that FOLLOWME agrees with its statement or description, nor does it constitute any investment advice. For all actions taken by visitors based on information provided by the FOLLOWME community, the community does not assume any form of liability unless otherwise expressly promised in writing.
FOLLOWME Trading Community Website: https://www.followme.com


Hot
No comment on record. Start new comment.