USD/CHF Price Analysis: Holds ground around 0.9200 on soft Swiss inflation data

- USD/CHF receives downward pressure due to the Soft Swiss inflation data.
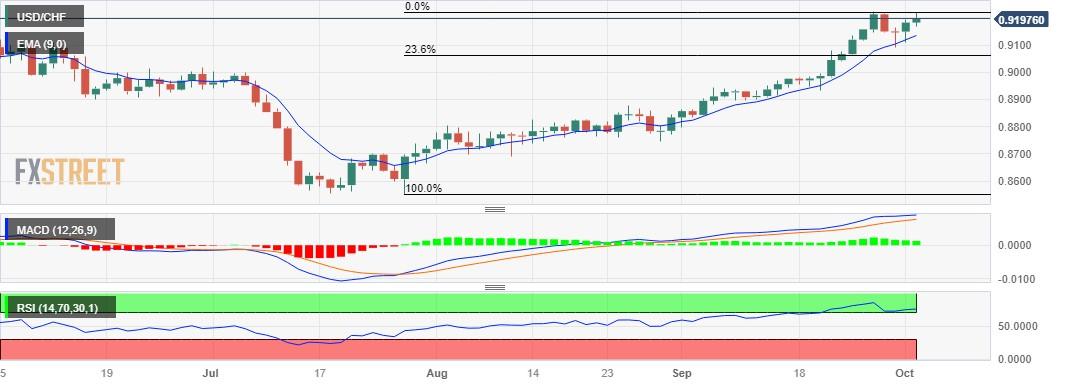
- Economic indicators suggest bullish momentum in the price movement.
- The major level at September’s high emerges as the immediate barrier, aligned to 0.9250 major level.
USD/CHF traces the upward path on the second day due to the firmer US data and weaker-than-expected Switzerland’s inflation figures. The Swiss Consumer Price Index (CPI) for September, increased to 1.7% (YoY) from the previous 1.6% rise, falling short of expectations at 1.8%.
On a monthly basis, inflation dipped to 0.1%, below the market consensus of flat 0.0%. The downbeat data has led to a loss of momentum for the Swiss Franc (CHF) against the US Dollar.
The current upward momentum in the pair suggests a bullish bias, with the 14-day Relative Strength Index (RSI) holding above the 50 level. The USD/CHF pair trades higher around the 0.9200 psychological level during the European session on Tuesday, followed by September’s high at the 0.9225 level.
A firm break above the level could open the doors for the pair to explore the region around the 0.9250 major level.
On the downside, the psychological level at 0.9150 could act as immediate support aligned with the seven-day Exponential Moving Average (EMA) at 0.9135.
A firm break below the latter could push the USD/CHF pair to navigate the region around 0.9100, following the 23.6% Fibonacci retracement at 0.9062.
The Moving Average Convergence Divergence (MACD) indicator is signaling strength for the Dollar bulls, with the MACD line positioned above the centerline and the signal line. This setup indicates potentially strong momentum in the USD/CHF price movement.
USD/CHF: Daily Chart
Reprinted from FXStreet_id,the copyright all reserved by the original author.
Disclaimer: The content above represents only the views of the author or guest. It does not represent any views or positions of FOLLOWME and does not mean that FOLLOWME agrees with its statement or description, nor does it constitute any investment advice. For all actions taken by visitors based on information provided by the FOLLOWME community, the community does not assume any form of liability unless otherwise expressly promised in writing.
FOLLOWME Trading Community Website: https://www.followme.com


Hot
No comment on record. Start new comment.