USD/CHF climbs back over 0.9150 as markets go risk-off

- USD/CHF floating back to the top side as Greenback rises on risk aversion.
- Franc buyers will be looking ahead to Tuesday's Swiss CPI reading.
- Another NFP Friday looms ahead, investors will be positioning early.
The USD/CHF sees a Monday rebound after last Friday's decline, and broad-market risk flows are seeing investors pile into the US Dollar (USD) ahead of another US Non-Farm Payrolls Friday.
US Manufacturing Purchasing Manager Index (PMI) figures on Monday came in mixed, with September's Manufacturing PMI printing a healthy 49 versus the expected uptick to 47.7. Upside potential was limited by manufacturing prices, with the ISM manufacturing inflation index declining to 43.8, missing the forecast improvement to 48.6.
Next up on the data docket for the USD/CHF will be the Swiss Consumer Price Index (CPI), which is slated for Tuesday at 06:30 GMT.
Swiss inflation is expected to improve from 1.6% to 1.8%, but momentum heading into the mid-week will be capped off by the US ISM Services PMI printing, forecast to decline from 54.5 to 53.6. US services inflation data is slated for Wednesday at 14:00 GMT.
USD/CHF: Downward path will eventually resume – UBS
USD/CHF technical outlook
The USD/CHF bounded 85 pips from Monday's early low to mark in an intraday high just shy of the 0.9200 handle, and the pair is currently softening into the midpoint near 0.9170. The pair remains well-bid above the 200-hour Simple Moving Average near 0.9110, but the near-term ceiling remains last week's swing high into 0.9225.
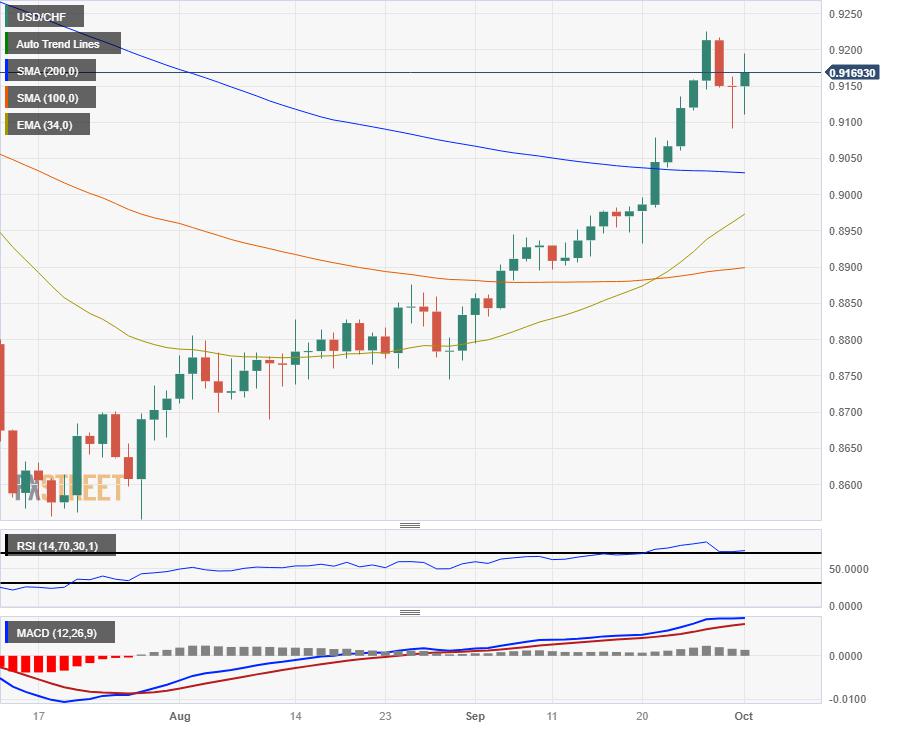
Daily candlesticks see the USD/CHF extending above the 200-day SMA near 0.9050, and a bearish confirmation would first have to decisively fall below the 34-day Exponential Moving Average (EMA) which is currently rising into the 0.9000 major handle and set for a bullish cross of the 200-day SMA.
USD/CHF daily chart
USD/CHF technical levels
Reprinted from FXStreet_id,the copyright all reserved by the original author.
Disclaimer: The content above represents only the views of the author or guest. It does not represent any views or positions of FOLLOWME and does not mean that FOLLOWME agrees with its statement or description, nor does it constitute any investment advice. For all actions taken by visitors based on information provided by the FOLLOWME community, the community does not assume any form of liability unless otherwise expressly promised in writing.
FOLLOWME Trading Community Website: https://www.followme.com


Hot
No comment on record. Start new comment.