Silver Price Analysis: XAG/USD tumbles over 5% as Silver whipsaws for Friday

- XAG/USD fell $1.28 during the US trading session, backsliding into $22.30.
- Bulls failed to establish a floor in XAG/USD prices and Silver slumped to a new weekly low.
- Broad-market reversal in risk appetite sending Silver into the floorboards.
Silver prices have tumbled from a late-week peak for Friday's trading, skidding into $22.30 after falling over 5.5% over the course of the US trading session.
The XAG/USD is back into familiar lows that Silver has cycled into for most of the year, driven by a resurgence in US Dollar (USD) bidding as global markets routinely pivot on fears of an impending economic slowdown that could roll over into a full-blown 'hard landing' if left unchecked.
Silver prices have consistently waffled on the top end ever since slipping from 2023's early peak above $26.00, a high set back in May.
Friday's sharp reversal only serves to highlight the XAG/USD's large exposure to broader market sentiment, tracking closely with US Dollar flows.
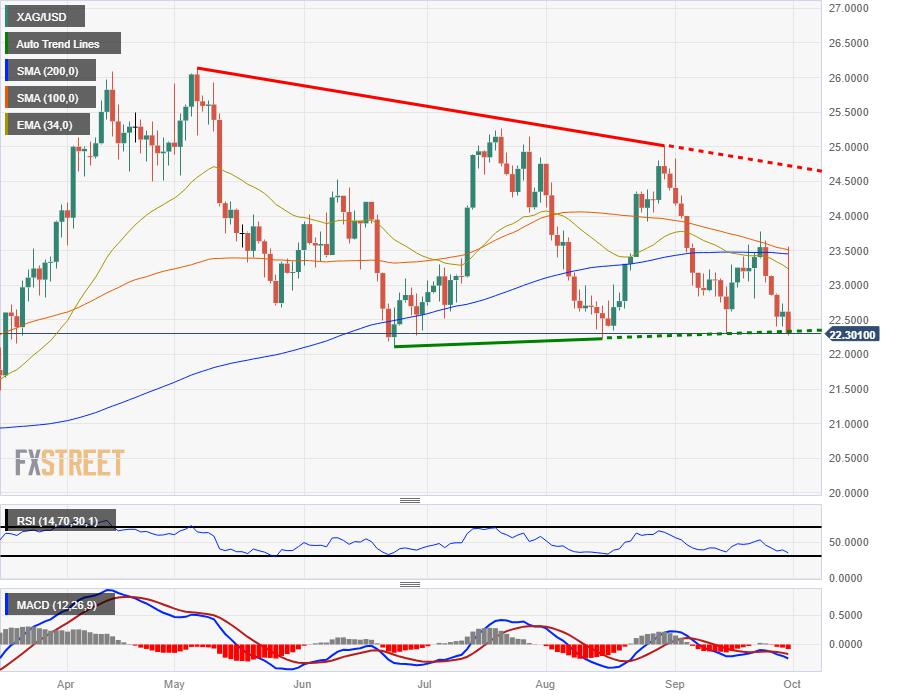
XAG/USD technical outlook
Silver is trading back into a familiar bottom just above the $22.00 major psychological level. A descending pattern of lower highs in XAG/USD is capping off long-term bullish potential, and a descending trendline is marked in from May's peak just north of $26.00.
Despite Friday's bomb-drop into the floor, the XAG/USD could potentially be set for another bullish turn around the cyclical pattern if Silver bidders can amass enough to arrest the current slide.
On the down side, if risk-off price pressure maintain through the weekend and into next week, Silver could see itself dropping further below $23.00 and set up a bearish push into $22.00 and beyond into six-month lows.
XAG/USD daily chart
XAG/USD technical levels
Reprinted from FXStreet_id,the copyright all reserved by the original author.
Disclaimer: The content above represents only the views of the author or guest. It does not represent any views or positions of FOLLOWME and does not mean that FOLLOWME agrees with its statement or description, nor does it constitute any investment advice. For all actions taken by visitors based on information provided by the FOLLOWME community, the community does not assume any form of liability unless otherwise expressly promised in writing.
FOLLOWME Trading Community Website: https://www.followme.com


Hot
No comment on record. Start new comment.