USD Index Price Analysis: There is a minor support around 104.70

- DXY extends the correction to the 105.70/65 band.
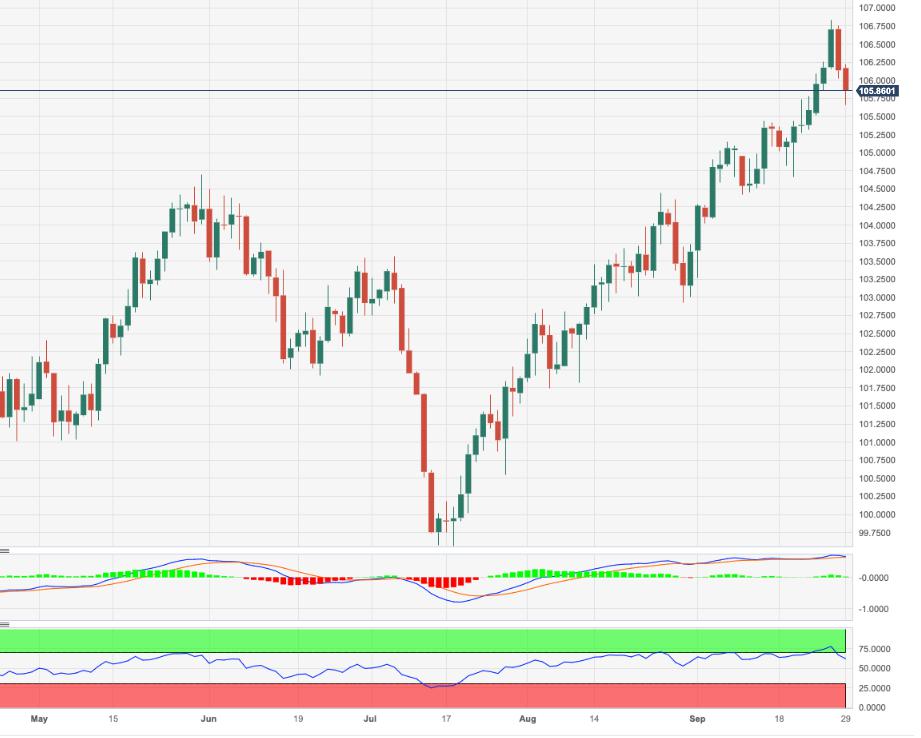
- A deeper pullback should meet contention near 104.70.
DXY adds to Thursday’s losses and briefly visits the vicinity of the 105.70 zone at the end of the week.
Despite the ongoing technical correction, extra gains appear likely for the time being. The surpass of the yearly high of 106.83 (September 27) could encourage the index to challenge the weekly top at 107.19 (November 30, 2022) prior to another weekly peak at 107.99 (November 21 2022).
In the meantime, while above the key 200-day SMA, today at 103.09, the outlook for the index is expected to remain constructive.
DXY daily chart
Reprinted from FXStreet_id,the copyright all reserved by the original author.
Disclaimer: The content above represents only the views of the author or guest. It does not represent any views or positions of FOLLOWME and does not mean that FOLLOWME agrees with its statement or description, nor does it constitute any investment advice. For all actions taken by visitors based on information provided by the FOLLOWME community, the community does not assume any form of liability unless otherwise expressly promised in writing.
FOLLOWME Trading Community Website: https://www.followme.com


Hot
No comment on record. Start new comment.