EUR/USD Price Analysis: Struggles to halt the losing streak near 1.0500

- EUR/USD attempts to stay above the 1.0500 psychological level.
- Momentum indicators suggest a potential bearish sentiment in the market.
- The region around January’s low could act as a key support.
EUR/USD attempts to snap the losing streak that began on September 19, hovering around 1.0500 psychological level during the Asian session on Thursday. The pair is under pressure due to risk aversion, coupled with upbeat US Treasury yields and economic data.
On Wednesday, Germany’s downbeat Gfk Consumer Confidence Survey exerted pressure on the EUR/USD pair. The consumer sentiment revealed a decline of -26.5 in October from -25.6 prior.
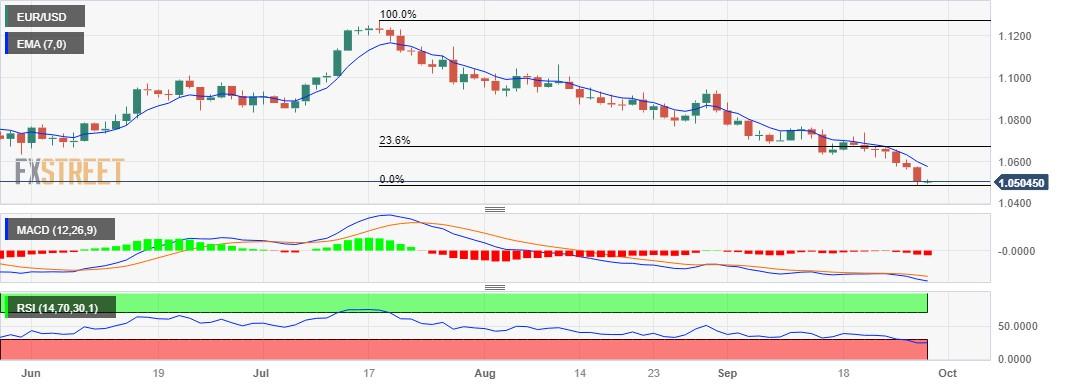
The current downward momentum in EUR/USD appears to have a potential bearish bias, given that the 14-day Relative Strength Index (RSI) remains below the 50 level. However, there is a support region around January’s low at 1.0481 that may pose a challenge for further losses.
If there's a breakthrough below the level, it could lead the EUR/USD bears to navigate the area around the psychological level at 1.0450.
On the upside, the EUR/USD pair may encounter significant resistance levels in its price movement. The seven-day Exponential Moving Average (EMA) at 1.0575 could act as a barrier, followed by the 1.0600 psychological level.
If the pair breaks above the latter, it may then explore the region around the 23.6% Fibonacci retracement at 1.0673.
The Moving Average Convergence Divergence (MACD) indicator is providing a bearish signal for the EUR/USD pair. The MACD line lies below the centerline and the signal line. This configuration suggests that there is potentially weak momentum in the price movement.
EUR/USD: Daily Chart
Reprinted from FXStreet_id,the copyright all reserved by the original author.
Disclaimer: The content above represents only the views of the author or guest. It does not represent any views or positions of FOLLOWME and does not mean that FOLLOWME agrees with its statement or description, nor does it constitute any investment advice. For all actions taken by visitors based on information provided by the FOLLOWME community, the community does not assume any form of liability unless otherwise expressly promised in writing.
FOLLOWME Trading Community Website: https://www.followme.com


Hot
No comment on record. Start new comment.