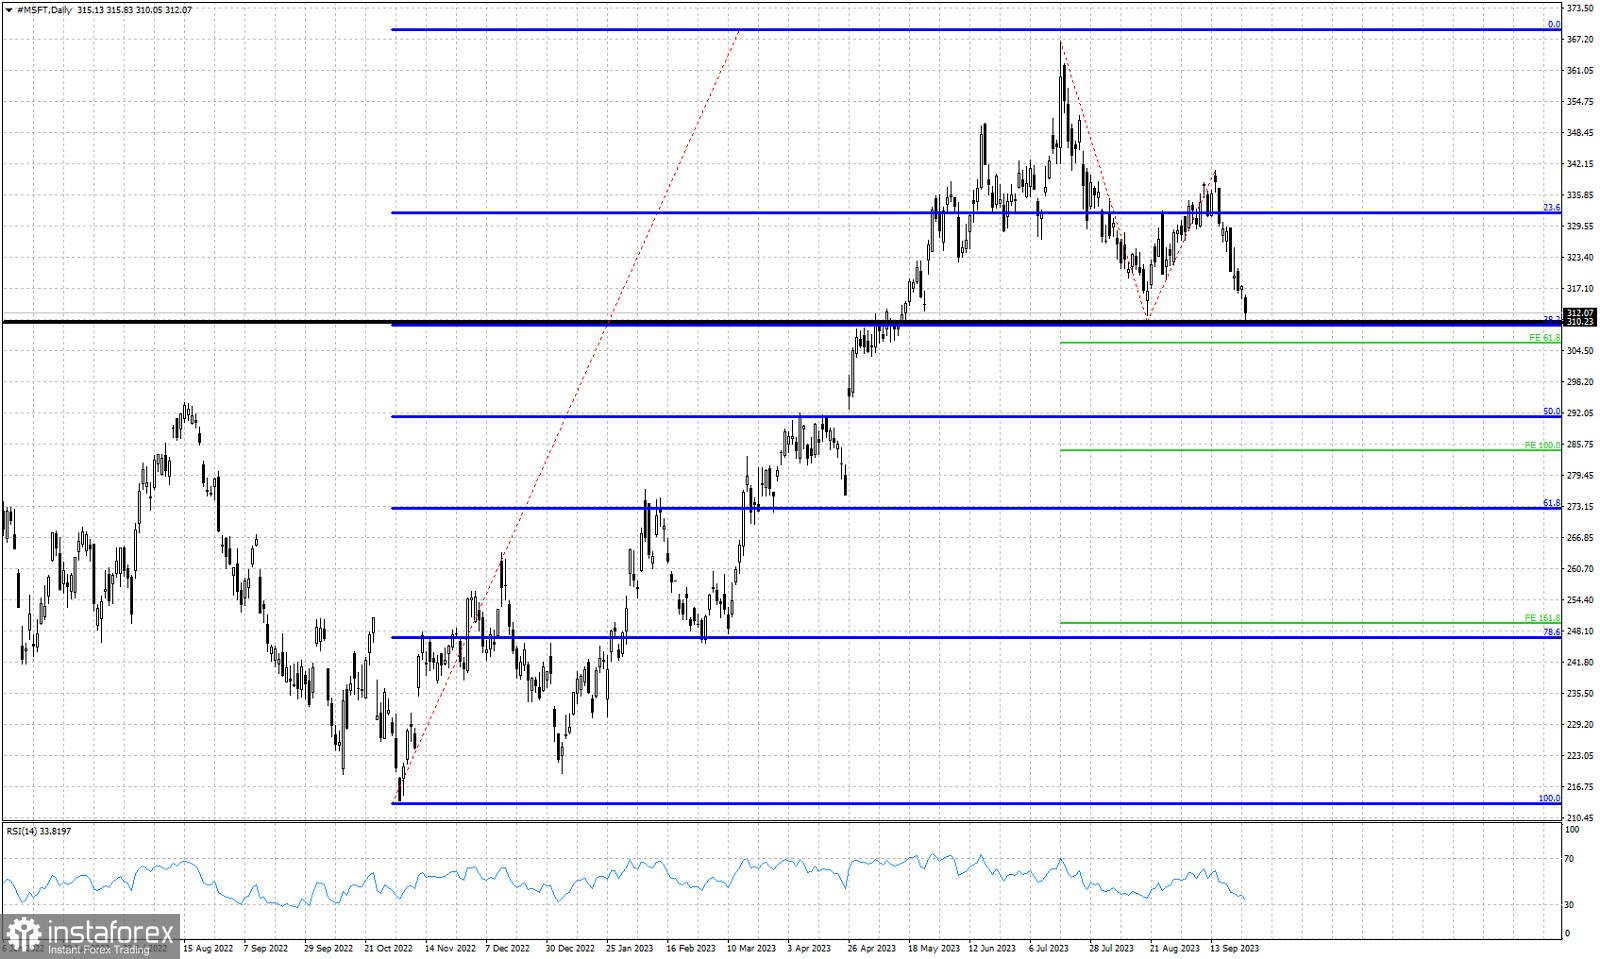
Garis hitam - support horizontal
Garis biru - level retracement Fibonacci
Garis hijau - target ekstensi Fibonacci
Mengikuti analisis kami sebelumnya pada harga saham MSFT, kami tetap bearish melihat kerentanan harga yang terwujud karena harga saham turun menuju level-level terendah bulan Agustus. Di kisaran level $310, kami menemukan 38% Fibonacci retracement dan garis tren hotizontal hitam. Keduanya menjadi support kunci untuk harga saham. Harga menembus ke bawah area support ini sangat memungkinkan. Tembusan harga seperti ini akan membuka jalan untuk penurunan yang lebih besar menuju $291, dimana kita menemukan 50% Fibonacci retracement, dan level harga $285 di mana kita menemukan target ekstensi Fibonacci 100%. Jika bulls berhasil menghindari support di $310, kemudian kita dapat melihat lambungan harga menuju area resistance $329.


Hot
No comment on record. Start new comment.