USD/CAD Price Analysis: Aims for a triangle breakout

- USD/CAD prints a fresh two-day high nominally above 1.3500 as the US Dollar resumes its upside journey.
- An extended correction in the oil price builds pressure on the Canadian Dollar.
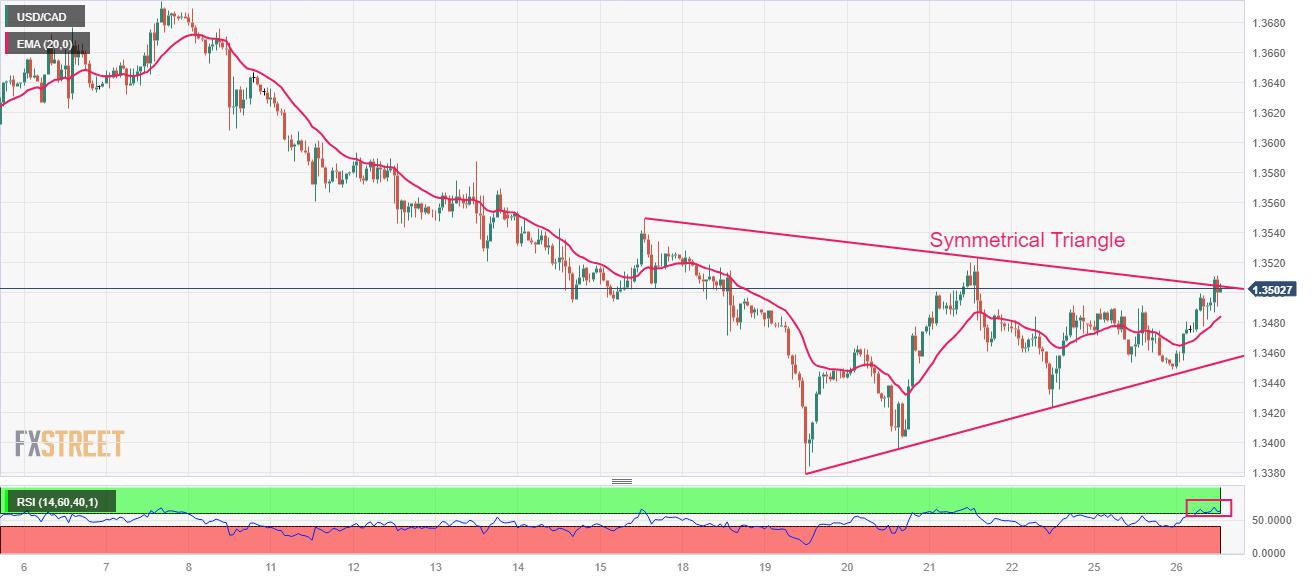
- USD/CAD trades near the downward-sloping trendline of the Symmetrical Triangle chart pattern around 1.3550.
The USD/CAD pair consolidates near the psychological resistance of 1.3500 in the early New York session. The Loonie asset strengthens as an extended correction in the oil price builds pressure on the Canadian Dollar.
The S&P500 opened on a negative note as Federal Reserve (Fed) policymakers delivered hawkish interest rate guidance. The US Dollar Index (DXY) delivers a nominal correction after printing a fresh 10-month high near 106.20.
Fed policymakers: Minneapolis Federal Reserve Bank President Neel Kashkari and Boston Fed President Susan Collins, supported for further policy-tightening as robust consumer spending could rebound inflationary pressures. Meanwhile, investors await the US Consumer Confidence and New Home Sales data.
USD/CAD trades near the downward-sloping trendline of the Symmetrical Triangle chart pattern, which is plotted from September 15 high around 1.3550. The upward-sloping trendline of the aforementioned chart pattern is placed from September 19 low at 1.3380. Advancing 20-period Exponential Moving Average (EMA) at 1.3485 indicates that the short-term trend is bullish.
The Relative Strength Index (RSI) (14) aims to shift into the bullish range of 60.00-80.00. A sustained RSI (14) movement in the bullish range would trigger a bullish impulse.
A decisive break above September 21 high at 1.3524 would drive the asset towards September 11 low around 1.3560, followed by the round-level resistance at 1.3600.
In an alternate scenario, a breakdown below September 25 low around 1.3450 would drag the asset toward September 20 low near 1.3400. A further breakdown could expose the asset to a six-week low near 1.3356.
USD/CAD hourly chart
Reprinted from FXStreet_id,the copyright all reserved by the original author.
Disclaimer: The content above represents only the views of the author or guest. It does not represent any views or positions of FOLLOWME and does not mean that FOLLOWME agrees with its statement or description, nor does it constitute any investment advice. For all actions taken by visitors based on information provided by the FOLLOWME community, the community does not assume any form of liability unless otherwise expressly promised in writing.
FOLLOWME Trading Community Website: https://www.followme.com


Hot
No comment on record. Start new comment.