NZD/USD Price Analysis: Remains inside woods ahead of Fed policy

- NZD/USD trades in a narrow range as investors await the Fed’s interest rate policy.
- The Fed is expected to keep interest rates unchanged amid falling inflation.
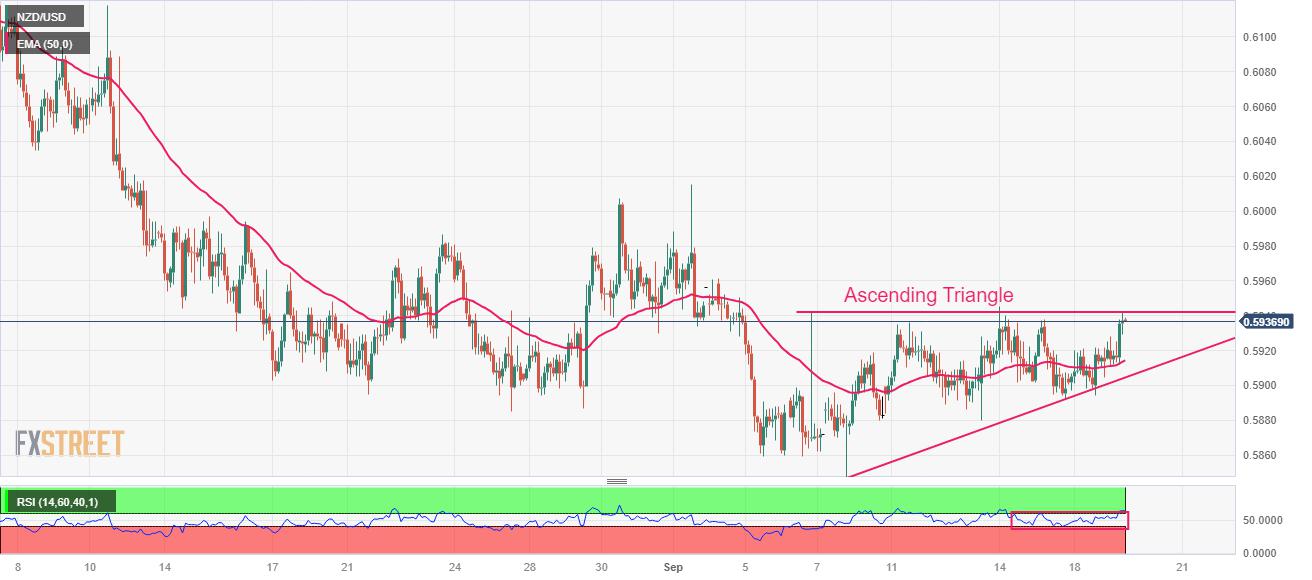
- NZD/USD trades in an Ascending Triangle chart pattern, which indicates a squeeze in volatility.
The NZD/USD pair has oscillated in a narrow range of 0.5900-0.5940 for the past four trading sessions. The Kiwi asset struggles to find as investors await the interest rate decision by the Federal Reserve (Fed), which will be announced on Wednesday.
The US Dollar Index (DXY) faces barricades in extending recovery further as the Fed is expected to deliver a neutral interest rate policy. The US economy is resilient due to easing inflationary pressures and stable labor growth, which would allow Fed policymakers to keep interest rates unchanged at 5.25-5.50%.
Meanwhile, the New Zealand Dollar will dance to the tune of the People’s Bank of China (PBoC) monetary policy, which is also scheduled for Wednesday. The PBoC is expected to continue to favor an expansionary policy framework to diminish deflation risks. Being a proxy for China’s economic recovery, an expansionary policy would support the New Zealand Dollar.
NZD/USD trades in an Ascending Triangle chart pattern on a two-hour scale, which indicates a squeeze in volatility. The upside of the aforementioned chart pattern is restricted near the horizontal resistance plotted from September 6 high at 0.5942 while the upward-sloping trendline is placed from September 7 low at 0.5847.
The 50-period Exponential Moving Average (EMA) at 0.5914 is extremely close to the asset, portraying a sideways trend.
Meanwhile, the Relative Strength Index (RSI) (14) attempts to shift into the bullish range of 60.0080.00. If the RSI (14) manages to do so, a bullish momentum will get triggered.
Going forward, a decisive break above September 14 high at 0.5945 would expose the asset to August 23 high around 0.5980, followed by August 8 low around 0.6035.
On the contrary, a breakdown below September 13 low at 0.5980 would drag the major toward September 7 low at 0.5847. A slippage below the latter would expose the asset to the round-level support at 0.5800.
NZD/USD two-hour chart
Reprinted from FXStreet_id,the copyright all reserved by the original author.
Disclaimer: The content above represents only the views of the author or guest. It does not represent any views or positions of FOLLOWME and does not mean that FOLLOWME agrees with its statement or description, nor does it constitute any investment advice. For all actions taken by visitors based on information provided by the FOLLOWME community, the community does not assume any form of liability unless otherwise expressly promised in writing.
FOLLOWME Trading Community Website: https://www.followme.com


Hot
No comment on record. Start new comment.