GBP/USD Price Analysis: Pair reverses below 1.2400, focus on central banks decisions

- GBP/USD continues to trade higher but has experienced a reversal below 1.2400.
- Momentum indicators indicate a potential bearish momentum in the Cable pair.
- The immediate support appears around June’s lows, followed by the 1.2350 psychological level.
GBP/USD snaps the two-day losing streak earlier in the day but later reverses, still trading higher around 1.2390 during the early trading hours of the European session on Monday. The pair experienced upward support, likely a result of the downbeat consumer sentiment data from the United States (US) released on Friday.
The preliminary US Michigan Consumer Sentiment Index recorded a reading of 67.7, indicating a decline from the previous figure of 69.5. This reading also fell below the expected figure of 69.1 for the month of September.
Investors are expecting the Bank of England (BoE) to raise interest rates by 25 basis points in the upcoming meeting on Thursday. On the other side, the US Federal Reserve (Fed) is expected to maintain its current interest rate on Wednesday.
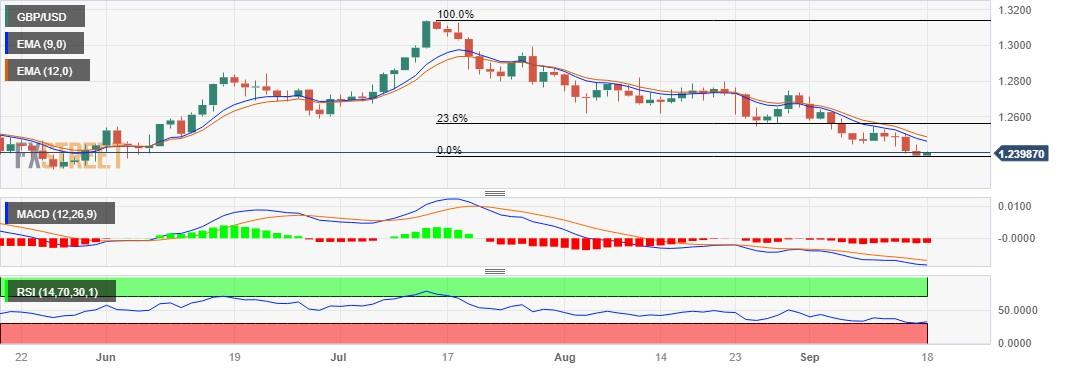
The GBP/USD pair could face a challenge around the nine-day Exponential Moving Average (EMA) at 1.2463, followed by the 12-day EMA at 1.2488 level.
A firm break above the 1.2500 psychological level could lead the pair to explore the region around 23.6% Fibonacci retracement at 1.2560.
On the flip side, immediate support for the GBP/USD pair appears around June’s lows at 1.2368, followed by the 1.2350 psychological level.
If bearish sentiment exerts pressure, the currency pair could potentially approach the next support level near the lows seen in May at 1.2308, followed by the 1.2300 psychological level.
The Moving Average Convergence Divergence (MACD) line remains below the centerline and shows divergence below the signal line. This configuration suggests a potential bearish momentum in the market, which can be seen as a signal that the recent downward trend may continue to exist.
Traders of the GBP/USD pair will likely observe the 14-day Relative Strength Index (RSI), which indicates bearish momentum in the short term as it lies below the 50 level.
GBP/USD: Daily Chart
Reprinted from FXStreet_id,the copyright all reserved by the original author.
Disclaimer: The content above represents only the views of the author or guest. It does not represent any views or positions of FOLLOWME and does not mean that FOLLOWME agrees with its statement or description, nor does it constitute any investment advice. For all actions taken by visitors based on information provided by the FOLLOWME community, the community does not assume any form of liability unless otherwise expressly promised in writing.
FOLLOWME Trading Community Website: https://www.followme.com


Hot
No comment on record. Start new comment.