AUD/USD Price Analysis: Remains confined around 0.6420, eyes on US CPI data

- AUD/USD oscillates in a narrow range around 0.6418, losing 0.12% on the day.
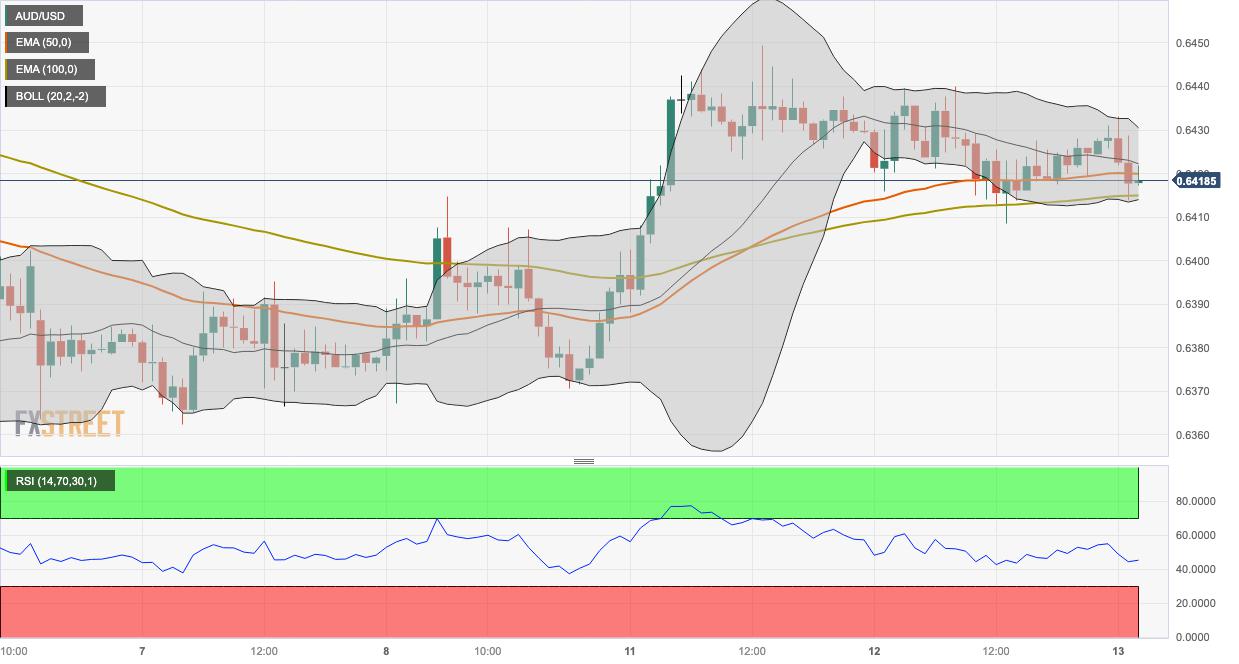
- The pair trades above the 50- and 100-hour EMAs on the one-hour chart.
- The immediate resistance level is seen at 0.6432; the key support level is located at the 0.6400-0.6410 region.
The AUD/USD pair remains confined around the 0.6410-0.6427 region in a narrow trading band during the Asian trading hours on Wednesday. The release of the US Consumer Price Index (CPI) on Wednesday and Australian employment data on Thursday could trigger volatility in the market.
Meanwhile, the Aussie (AUD) is capped by the downbeat Australian data. Data released on Tuesday reported that Australia’s Westpac Consumer Confidence for September fell by 1.5% to 79.7, following a 0.4% drop In the previous reading. The figure has remained below 100, the longest period since the early 1990s recession, and fueled concern about the impact of the economic slowdown in China.
From the technical perspective, the AUD/USD pair trades above the 50- and 100-hour Exponential Moving Averages (EMAs) on the one-hour chart, indicating that the path of least resistance for the pair is to the upside.
The immediate resistance level for AUD/USD is seen near the upper boundary of the Bollinger Band at 0.6432. Further north, the 0.6500-0.6505 regions appear a tough nut to crack for Aussie bears. The mentioned level represents the confluence of a psychological round mark and a high of August 14. Any meaningful follow-through buying above the latter could pave the way to 0.6522 (high of August 15) and 0.6570 (high of August 9).
On the flip side, the key support level is located at the 0.6400-0.6410 region, representing the lower limit of the Bollinger Band, 100-hour EMA, and a psychological round figure. A decisive breach of the latter will see the next stop at 0.6380 (low of August 25) and finally at 0.6365 (low of August 17).
It’s worth noting that the Relative Strength Index (RSI) stands in bearish territory below 50, challenging the pair’s immediate downside for the time being.
AUD/USD one-hour chart
Reprinted from FXStreet_id,the copyright all reserved by the original author.
Disclaimer: The content above represents only the views of the author or guest. It does not represent any views or positions of FOLLOWME and does not mean that FOLLOWME agrees with its statement or description, nor does it constitute any investment advice. For all actions taken by visitors based on information provided by the FOLLOWME community, the community does not assume any form of liability unless otherwise expressly promised in writing.
FOLLOWME Trading Community Website: https://www.followme.com


Hot
No comment on record. Start new comment.