NZD/USD plunges to lows since November 2022 below 0.5900

- The NZD/USD lost nearly 1%, falling below the key level of 0.5900.
- The USD benefits from a cautious market sentiment.
- Factory orders decreased in the US in July at a higher pace than expected.
- The RBA held rates steady, just as expected.
The NZD/USD faced selling pressure mainly driven by a stronger USD in a cautious market environment. The US reported weak Factory Orders from July, which declined faster than expected but didn’t stop the Greenback’s momentum. On the other hand, alongside the AUD, the NZD is the worst performer of the session after the Reserve Bank of Australia (RBA) decided to hold rates steady at 4.10%, just as expected.
No relevant data will be released for the US for the rest of the session, but its DXY index climbed to a multi-month high of 104.80 as the Greenback benefits from a cautious market sentiment. In that sense, markets await fresh catalysts to continue placing their bets on the next Federal Reserve (Fed) decisions. The World Interest Rates Probabilities (WIRP) suggests that markets still foresee some possibilities of the Fed pursuing an additional 0.25% tightening by the December meeting, with the target rate ultimately reaching 5.75%.
The New Zealander calendar was also empty on Tuesday. Meanwhile, the Interest Rates Probabilities (WIRP) tool suggests that investors are firmly convinced that the Reserve Bank of New Zealand (RBNZ) will not announce any rate increases leading up to the February meeting and will keep rates stable at 5.5%. In that sense, if the Fed doesn't end its tightening cycle, monetary policy divergences may continue to weaken the NZD.
NZD/USD Levels to watch
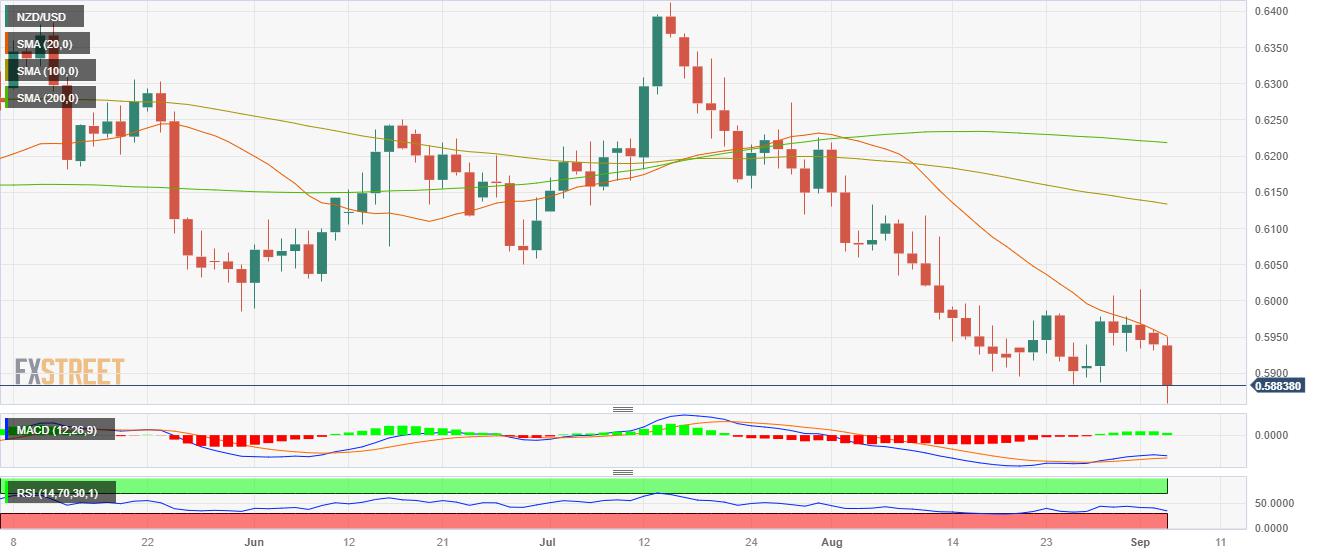
Analyzing the daily chart, the NZD/USD technical outlook is bearish in the short term. The Relative Strength Index (RSI) is comfortably positioned below its midline in negative territory. It has a southward slope, indicating a favourable selling momentum and it is further supported by the negative signal from the Moving Average Convergence Divergence (MACD), which displays red bars, underscoring the growing bearish momentum. Moreover, the pair is below the 20,100 and 200-day Simple Moving Averages (SMAs), indicating that the sellers dominate the broader perspective.
Support levels: 0.5850, 0.5830, 0.5800.
Resistance levels: 0.5900, 0.5950 (20-day SMA), 0.5970.
NZD/USD Daily Chart
Reprinted from FXStreet_id,the copyright all reserved by the original author.
Disclaimer: The content above represents only the views of the author or guest. It does not represent any views or positions of FOLLOWME and does not mean that FOLLOWME agrees with its statement or description, nor does it constitute any investment advice. For all actions taken by visitors based on information provided by the FOLLOWME community, the community does not assume any form of liability unless otherwise expressly promised in writing.
FOLLOWME Trading Community Website: https://www.followme.com


Hot
No comment on record. Start new comment.