AUD/USD Price Analysis: Extends post-RBA fall towards poking 13-day-old support near 0.6400

- AUD/USD takes offers to refresh weekly low, prods short-term key support line.
- Unimpressive RBA verdict, US Dollar’s rebound favor Aussie pair sellers.
- Clear downside break of 10-DMA, U-turn from important resistance zone add strength to bearish bias.
11-month-old rising support line, below-50.0 RSI will test sellers during further dominance.
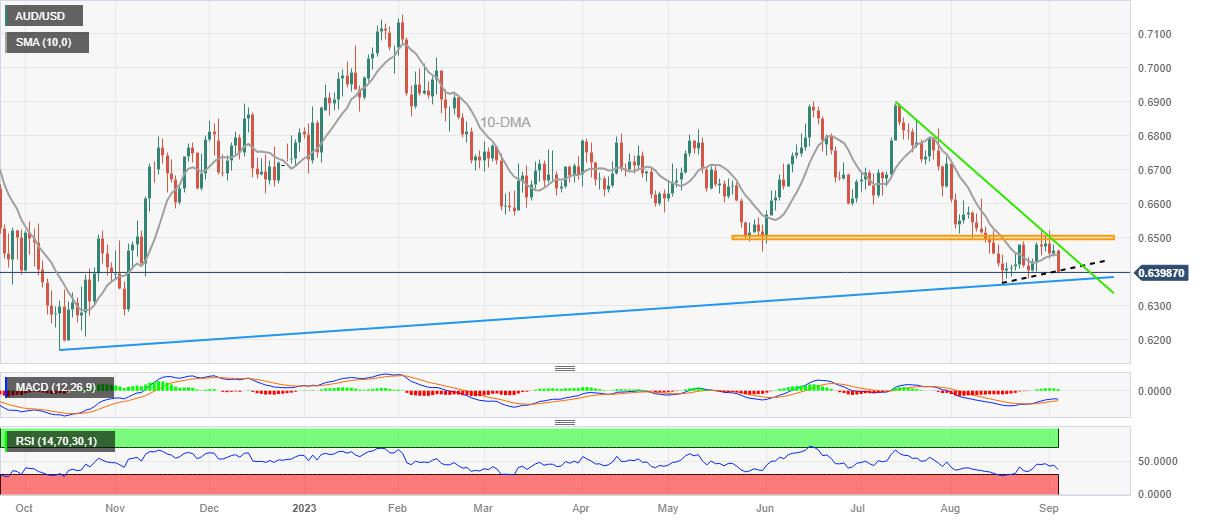
AUD/USD stands on slippery grounds as it refreshes the weekly low around 0.6395 during early Tuesday in Europe. In doing so, the Aussie pair justifies the Reserve Bank of Australia’s (RBA) inaction, as well as a cautious view about the economic growth and inflation conditions.
Technically, the risk barometer pair extends the early-day break of the 10-DMA as sellers attack a two-week-long rising support line.
It’s worth noting that the quote’s inability to cross the levels marked in late May and early June, around 0.6500 joins the looming bear cross on the MACD to also keep the AUD/USD sellers hopeful of breaking the immediate support line surrounding 0.6400.
However, the below-50.0 levels of the RSI (14) line suggest bottom-picking of the Aussie pair and hence highlights an upward-sloping support line from October 2022, close to 0.6370 at the latest, as an important support to watch. Also acting as the downside filter is the previous monthly low of around 0.6365.
Alternatively, a daily closing beyond the 10-DMA hurdle of around 0.6450 isn’t an open invitation to the AUD/USD buyers as a descending resistance line from July 13 surrounding 0.6480 challenges the pair’s immediate upside.
Following that, the aforementioned resistance area comprising levels marked in May–June, around 0.6500, will be in the spotlight.
Overall, the AUD/USD pair is likely to decline further but the downside appears limited as the key support line holds.
AUD/USD: Daily chart
Trend: Limited downside expected
Reprinted from FXStreet_id,the copyright all reserved by the original author.
Disclaimer: The content above represents only the views of the author or guest. It does not represent any views or positions of FOLLOWME and does not mean that FOLLOWME agrees with its statement or description, nor does it constitute any investment advice. For all actions taken by visitors based on information provided by the FOLLOWME community, the community does not assume any form of liability unless otherwise expressly promised in writing.
FOLLOWME Trading Community Website: https://www.followme.com


Hot
No comment on record. Start new comment.