AUD/JPY Price Analysis: Steady as Asian markets open at around 94.60s, RBA eyed

- AUD/JPY pair inches up 0.04% to trade at 94.65, following a 0.30% gain on Monday, as it approaches a key resistance trendline at 94.90/95.00.
- The pair remains neutral/upwards, with significant resistance at a July 25 high of 95.85 and the psychological 96.00 figure.
- Short-term, the AUD/JPY 1-hour chart indicates consolidation around the daily pivot, with first support and resistance levels identified at 94.50/51 and 94.84, respectively.
As Tuesday’s Asian session begins, the Aussie Dollar (AUD) climbs a minuscule 0.04% against the Japanese Yen (JPY), following Monday’s upbeat session, the AUD/JPY gained more than 0.30%. The cross-currency pair exchanges hands at 94.65, ahead of the Reserve Bank of Australia’s (RBA) monetary policy decision.
AUD/JPY Price Analysis: Technical outlook
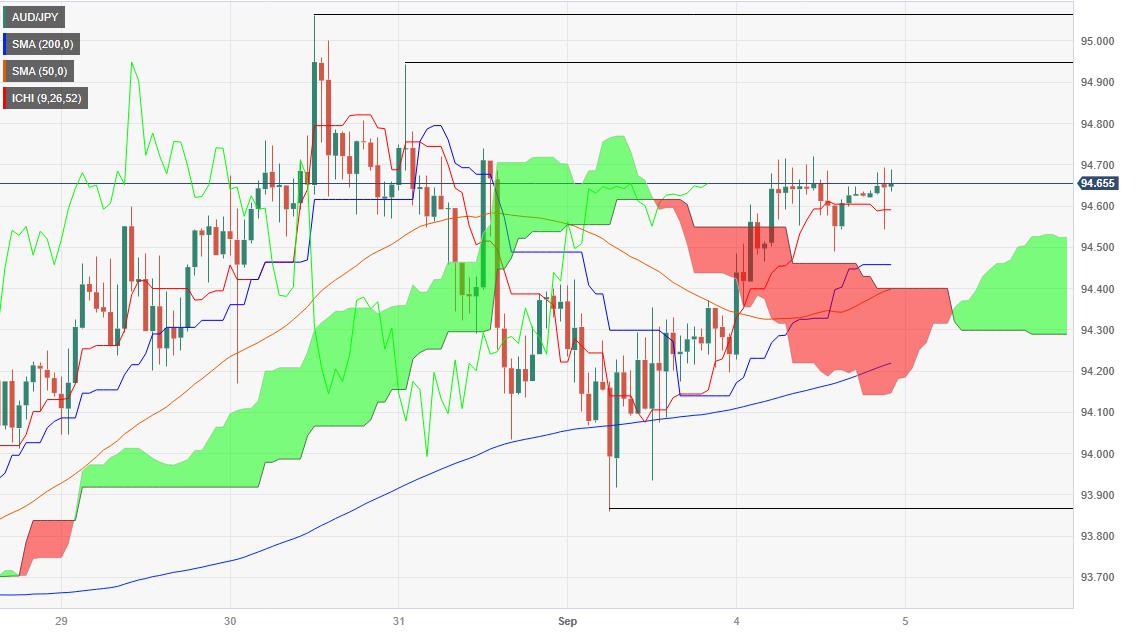
From a daily chart perspective, the AUD/JPY remains neutral to upward biased, with the cross above the Ichimoku cloud, but about to face solid resistance at a downslope resistance trendline at around 94.90/95.00. A breach of that area would expose the July 25 high at 95.85 before the pair edges toward the psychological 96.00 mark. Downside risks emerge at around the top of the Ichimoku Cloud (Kumo) at 94.08, followed by an upslope support trendline at 93.50/60.
In the short term, the 1-hour chart depicts the pair consolidating art around the daily pivot, with upside risks seen above yesterday’s high of 94.72. Next, resistance emerges at the R1 daily pivot at 94.84, followed by the August 30 high at 5.06, confluence with the R2 daily pivot. Conversely, the AUD/JPY first support emerges at the Senkou-Span A and the daily pivot at 94.50/51. The break below will expose the confluence of the Senkou Span B and the S1 pivot at 94.28.
AUD/JPY Price Action – Hourly chart
Reprinted from FXStreet_id,the copyright all reserved by the original author.
Disclaimer: The content above represents only the views of the author or guest. It does not represent any views or positions of FOLLOWME and does not mean that FOLLOWME agrees with its statement or description, nor does it constitute any investment advice. For all actions taken by visitors based on information provided by the FOLLOWME community, the community does not assume any form of liability unless otherwise expressly promised in writing.
FOLLOWME Trading Community Website: https://www.followme.com


Hot
No comment on record. Start new comment.