GBP/JPY Price Analysis: Recovery remains elusive below 186.10

- GBP/JPY renews intraday high during the first positive daily performance in three.
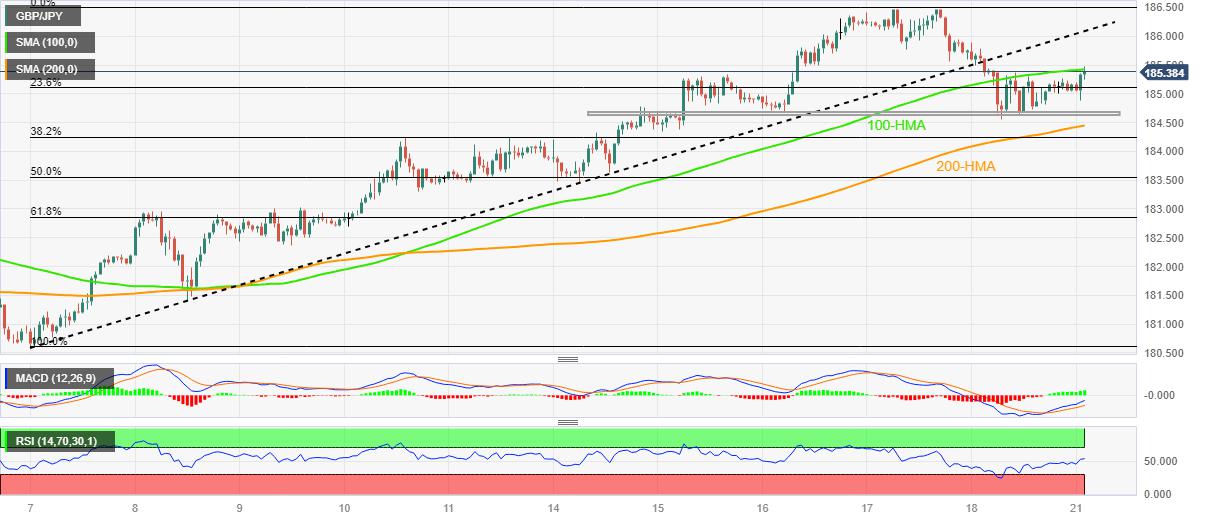
- 100-HMA, two-week-old previous support line prod buyers before giving them control.
- Upbeat oscillators, U-turn from weekly horizontal support suggest further upside momentum.
GBP/JPY picks up bids to refresh intraday high near 185.45 as bulls attack the 100-Hour Moving Average (HMA) during the first positive day in three amid early Monday. In doing so, the cross-currency pair extends the previous day’s rebound from a one-week-old horizontal support area to poke the key moving average.
Adding strength to the bullish bias are the upbeat MACD signals and the RSI (14) line, which in turn suggests the quote’s further upside past the immediate 100-HMA hurdle of around 185.50.
That said, the support-turned-resistance line from August 07, close to 186.10 at the latest, acts as the final defense of the GBP/JPY bears.
Following that, the pair’s uptrend towards challenging the multi-year high marked the last week around 186.50, as well as the November 2015 high of 188.40, can’t be ruled out.
On the flip side, a clear break of the aforementioned horizontal support zone of around 184.70-60, becomes necessary for the intraday sellers.
Even so, the 200-HMA support of around 184.45 and the double tops marked on August 10–11 near 184.25-20, could challenge the GBP/JPY bears.
In a case where the quote remains bearish past 184.20, the 184.00 round figure and the monthly low of around 180.60 will be in the spotlight.
GBP/JPY: Hourly chart
Trend: Further upside expected
Reprinted from FXStreet_id,the copyright all reserved by the original author.
Disclaimer: The content above represents only the views of the author or guest. It does not represent any views or positions of FOLLOWME and does not mean that FOLLOWME agrees with its statement or description, nor does it constitute any investment advice. For all actions taken by visitors based on information provided by the FOLLOWME community, the community does not assume any form of liability unless otherwise expressly promised in writing.
FOLLOWME Trading Community Website: https://www.followme.com


Hot
No comment on record. Start new comment.