USD/CAD Price Analysis: Pierces 200-DMA, key resistance line as Canada Inflation, Fed Minutes loom

- USD/CAD takes the bids to refresh intraday high, jostles with crucial resistances.
- Bullish MACD signals, sustained upside break of four-month-old rising trend line favor Loonie pair buyers.
- Sellers need validation from April’s low to retake control.
USD/CAD crosses the 200-DMA hurdle as bulls attack the five-month-old descending resistance line early Monday in Europe. In doing so, the Loonie pair justifies the retreat in the WTI crude oil prices, Canada’s key export item, while taking clues from the firmer US Treasury bond yields and the US Dollar amid sour sentiment. That said, the major currency pair rises 0.11% intraday to near 1.3460 by the press time.
Also read: USD/CAD holds ground near the 1.3440 mark, eyes on Canadian CPI, US Retail Sales
Apart from the aforementioned fundamentals, a successful break of the rising trend line from April 14, close to 1.3400, joins the bullish MACD signals to keep the USD/CAD buyers hopeful.
However, a daily closing beyond the stated resistance line, close to 1.3460 at the latest, becomes necessary for the Loonie pair buyers to keep the reins.
Also likely to challenge the USD/CAD buyers is the monthly high of near 1.3500, a break of which could propel the prices toward a horizontal area comprising multiple tops marked since late April, close to 1.3655–70.
On the flip side, USD/CAD sellers will seek a daily closing beneath the 200-DMA level of 1.3450 to rethink returning from the camp.
Even so, a four-month-long rising trend line near 1.3400 will test the Loonie pair’s downside before giving control to the bears.
USD/CAD: Daily chart
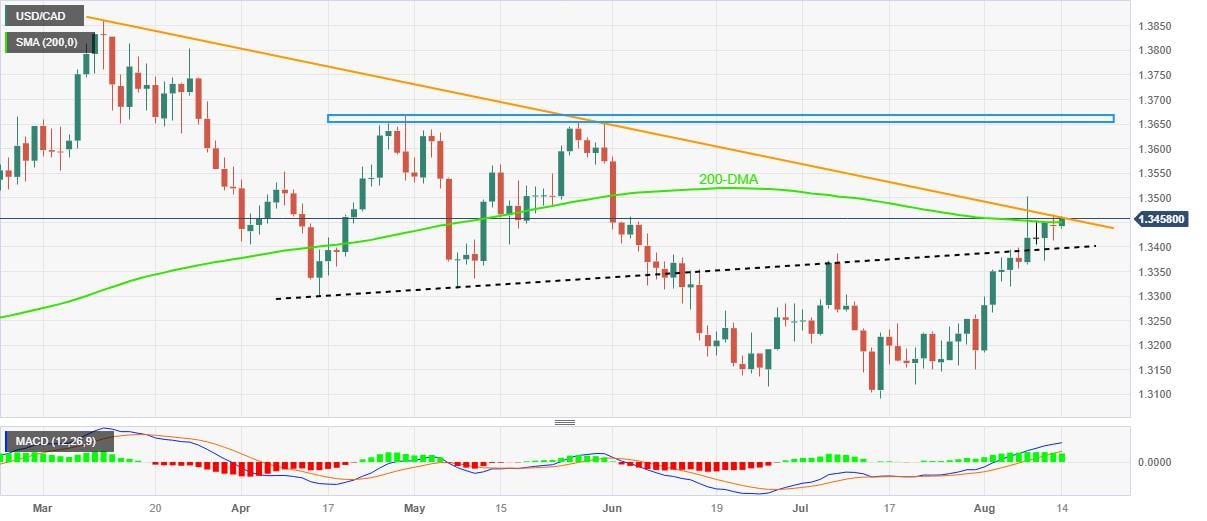
Trend: Further upside expected
Reprinted from FXStreet_id,the copyright all reserved by the original author.
Disclaimer: The content above represents only the views of the author or guest. It does not represent any views or positions of FOLLOWME and does not mean that FOLLOWME agrees with its statement or description, nor does it constitute any investment advice. For all actions taken by visitors based on information provided by the FOLLOWME community, the community does not assume any form of liability unless otherwise expressly promised in writing.
FOLLOWME Trading Community Website: https://www.followme.com


Hot
No comment on record. Start new comment.