USD/INR Price Analysis: Weekly hurdle prods Indian Rupee recovery near 82.20

- USD/INR struggles for clear directions after snapping three-day uptrend the previous day.
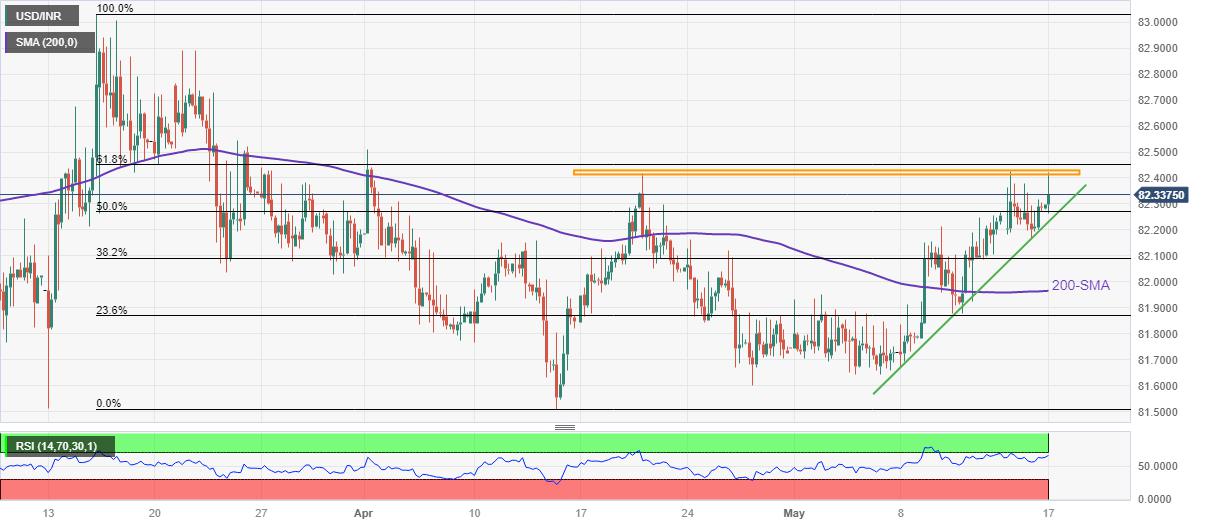
- One-month-old horizontal region, ascending trend line from May 07 limit immediate moves of Indian Rupee pair.
- Upbeat RSI (14) suggests continuation of northward grind; 200-SMA acts as the last defense of USD/INR bulls.
USD/INR treads water around 82.30 as it jostles with the one-month-old horizontal resistance area during early Wednesday.
That said, the Indian Rupee (INR) pair retreated from the stated hurdle surrounding 82.40-42 the previous day while printing the first daily loss in four.
However, the upbeat RSI (14) line, not overbought, favors the extension of the Indian Rupee (INR) pair’s slow grind toward the north triggered earlier in May. With this, the USD/INR pair buyers are hopeful of overcoming the 82.42 resistance zone.
Following that, the 61.8% Fibonacci retracement level of the pair’s March-April downside, near 82.45 and the previous monthly high of around 82.50 may check the USD/INR bulls before directing them to the March’s high of 83.03.
Alternatively, a one-week-old ascending support line, close to 82.20 by the press time, puts a floor under the USD/INR prices for the short term.
In a case where the USD/INR breaks the 82.20 support, the 82.00 psychological magnet and the 200-SMA surrounding 81.95 could probe the pair sellers before giving them control.
To sum up, USD/INR is expected to keep the latest upside move but the road toward the north is long and bumpy.
USD/INR: Four-hour chart
Trend: Gradual upside expected
Reprinted from FXStreet_id,the copyright all reserved by the original author.
Disclaimer: The content above represents only the views of the author or guest. It does not represent any views or positions of FOLLOWME and does not mean that FOLLOWME agrees with its statement or description, nor does it constitute any investment advice. For all actions taken by visitors based on information provided by the FOLLOWME community, the community does not assume any form of liability unless otherwise expressly promised in writing.
FOLLOWME Trading Community Website: https://www.followme.com


Hot
No comment on record. Start new comment.