USD/JPY Price Analysis: More downside seems favored as US yields extend losses

- USD/JPY is struggling to extend its recovery above 131.00.
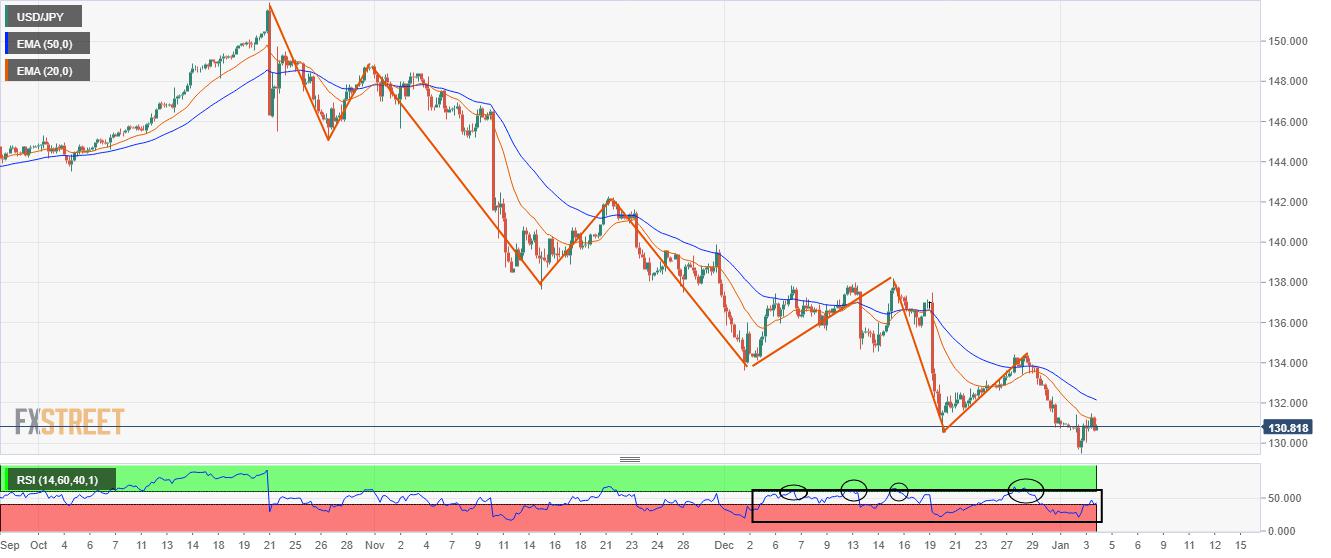
- A spree of lower highs in the asset indicates a continuation of the downside trend.
- Downward-sloping 20-and 50-EMAs add to the downside filters.
The USD/JPY pair is struggling to extend its recovery above 131.00 in the early European session. Earlier, the asset rebounded after sensing buying interest around 129.50 as investors underpinned the US Dollar amid a risk-off market mood.
The US Dollar Index (DXY) is displaying a subdued performance as investors are awaiting a fresh trigger for a decisive move.
On a four-hour scale, one could easily identify the continuation of the downtrend and the absence of any recovery move from the US Dollar. The Relative Strength Index (RSI) (14) is constantly failing to overstep 60.00, which indicates the presence of a ‘sell on rise’ context in the trading activity.
Apart from that, downward-sloping 20-and 50-period Exponential Moving Averages (EMAs) at 131.15 and 132.15 indicates more weakness ahead.
It would be prudent to wait for a pullback move to near the 50-period EMA around 132.15 for building a short position, which will drag the asset toward the psychological resistance at 130.00 followed by May 4 low at 128.63.
On the flip side, a rebound move above December 29 high at 134.50 will drive the asset towards December 7 low around 134.00. A breach above the latter will send the asset towards December 20 high at 137.47.
USD/JPY four-hour chart
Reprinted from FXStreet_id,the copyright all reserved by the original author.
Disclaimer: The content above represents only the views of the author or guest. It does not represent any views or positions of FOLLOWME and does not mean that FOLLOWME agrees with its statement or description, nor does it constitute any investment advice. For all actions taken by visitors based on information provided by the FOLLOWME community, the community does not assume any form of liability unless otherwise expressly promised in writing.
FOLLOWME Trading Community Website: https://www.followme.com


Hot
No comment on record. Start new comment.