AUD/USD Price Analysis: Bulls cheer ‘golden cross’ to approach fortnight-old resistance near 0.6765

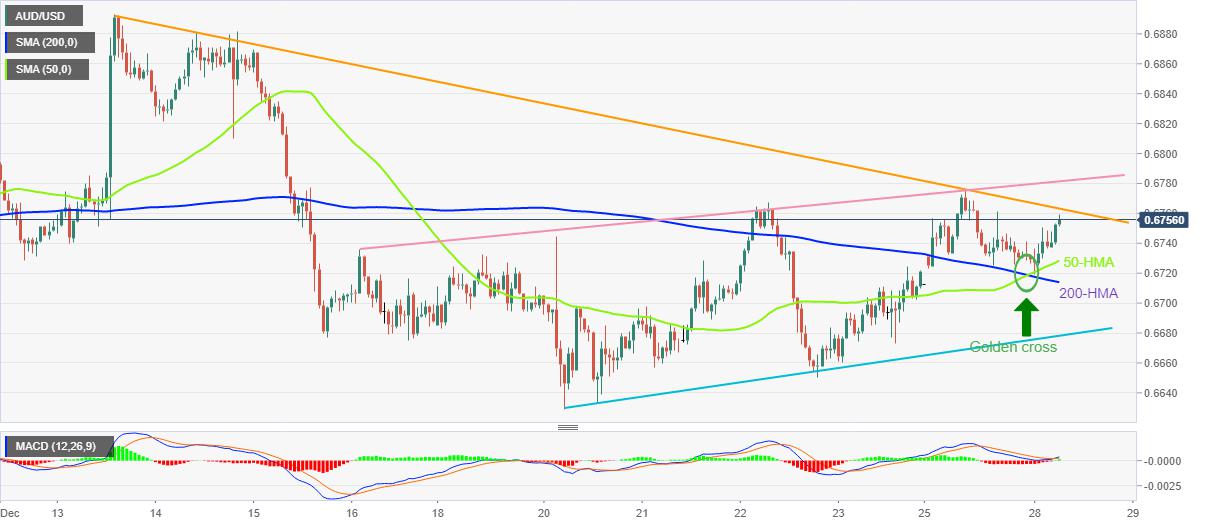
- AUD/USD picks up bids to refresh intraday high after confirming a bullish moving average crossover.
- Two-week-long downward-sloping resistance line challenges short-term upside moves.
- MACD signals suggest further upside, rising trend line from December 16 adds to the upside filters.
AUD/USD renews intraday high around 0.6755 while reversing the previous day’s pullback from the two-week top amid the initial European session on Wednesday.
In doing so, the Aussie pair justifies the bullish moving average crossover amid sluggish days of trading due to the year-end holiday mood in the West.
That said, the 50-HMA pierced the 200-HMA from below and portrayed the “Golden Cross” the previous day. The MACD also justifies the bullish signals from the Hourly Moving Averages (HMAs).
As a result, the quote is up for challenging a two-week-old resistance line near 0.6765. However, another trend line resistance from December 16, close to 0.6780, adds filters to the AUD/USD upside.
In a case where the Aussie pair remains firmer past 0.6780, the 0.6800 round figure and 0.6820 hurdle may probe the bulls before directing them towards the monthly high near 0.6895.
On the flip side, the 50-HMA level near 0.6730 restricts short-term AUD/USD downside ahead of the 200-HMA support, close to 0.6715 at the latest.
Following that, an ascending trend line from the last Tuesday, near 0.6680 by the press time, could act as the last defense of the AUD/USD bulls, a break of which could quickly drag the quote towards the monthly low surrounding 0.6630.
AUD/USD: Hourly chart
Trend: Limited upside expected
Reprinted from FXStreet_id,the copyright all reserved by the original author.
Disclaimer: The content above represents only the views of the author or guest. It does not represent any views or positions of FOLLOWME and does not mean that FOLLOWME agrees with its statement or description, nor does it constitute any investment advice. For all actions taken by visitors based on information provided by the FOLLOWME community, the community does not assume any form of liability unless otherwise expressly promised in writing.
FOLLOWME Trading Community Website: https://www.followme.com


Hot
No comment on record. Start new comment.