EUR/USD Price Analysis: Seesaws near 1.0400 with eyes on three-month-old resistance

- EUR/USD remains sidelined after posting the biggest daily gains in over a week.
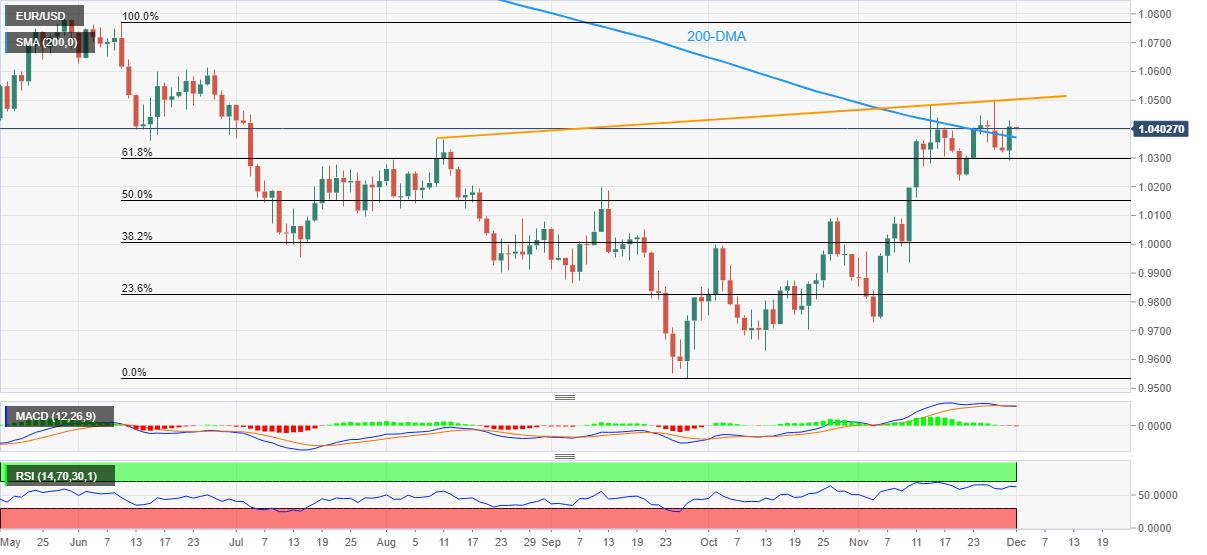
- Bulls eye ascending resistance line from August on closing break of 200-DMA.
- 61.8% Fibonacci retracement level adds to the downside filters.
- MACD, RSI challenge bullish bias but bears have a long way to go before taking control.
EUR/USD bulls take a breather around 1.0400 during early Thursday, following the heavy run-up before a few hours, as traders await fresh clues to extend Fed Chair Jerome Powell-led gains. Also likely to have challenged the pair buyers are the signals from the Moving Average Convergence and Divergence (MACD) indicator and the Relative Strength Index (RSI) line, placed at 14.
Even so, the major currency pair’s sustained closing beyond the 200-DMA, around 1.0370 by the press time, keeps the buyers hopeful. On the same line could be the quote’s successful rebound from the 61.8% Fibonacci retracement level of June-September downside, close to 1.0300.
With this, the EUR/USD bulls keep their eyes on an upward-sloping resistance line from August 10, near 1.0500 at the latest, before targeting the late June swing high around 1.0615 and June’s peak surrounding 1.0775.
It should be noted that the impending bear cross on the MACD and the RSI’s nearness to the overbought territory suggests limited upside room for the quote.
However, the EUR/USD sellers may not risk entries until witnessing a clear break of the 61.8% Fibonacci retracement level, also known as the golden ratio, currently around 1.0300. That said, the 200-DMA level near 1.0370 restricts the immediate downside of the pair.
Should the quote drops below 1.0300, the previous weekly low near 1.0220 and September’s peak near 1.0200 could challenge the EUR/USD bears.
EUR/USD: Daily chart
Trend: Limited upside expected
Reprinted from FXStreet_id,the copyright all reserved by the original author.
Disclaimer: The content above represents only the views of the author or guest. It does not represent any views or positions of FOLLOWME and does not mean that FOLLOWME agrees with its statement or description, nor does it constitute any investment advice. For all actions taken by visitors based on information provided by the FOLLOWME community, the community does not assume any form of liability unless otherwise expressly promised in writing.
FOLLOWME Trading Community Website: https://www.followme.com


Hot
No comment on record. Start new comment.