USD/CAD Price Analysis: Six-week-old support probes bears around 1.2800

- USD/CAD remains pressured around 1.5-month low, bears approach descending support line from mid-June.
- Bearish MACD signals, downbeat RSI joins daily closing below 100-day EMA to favor sellers.
- Buyers need validation from monthly horizontal resistance, sellers could aim for 200-day EMA.
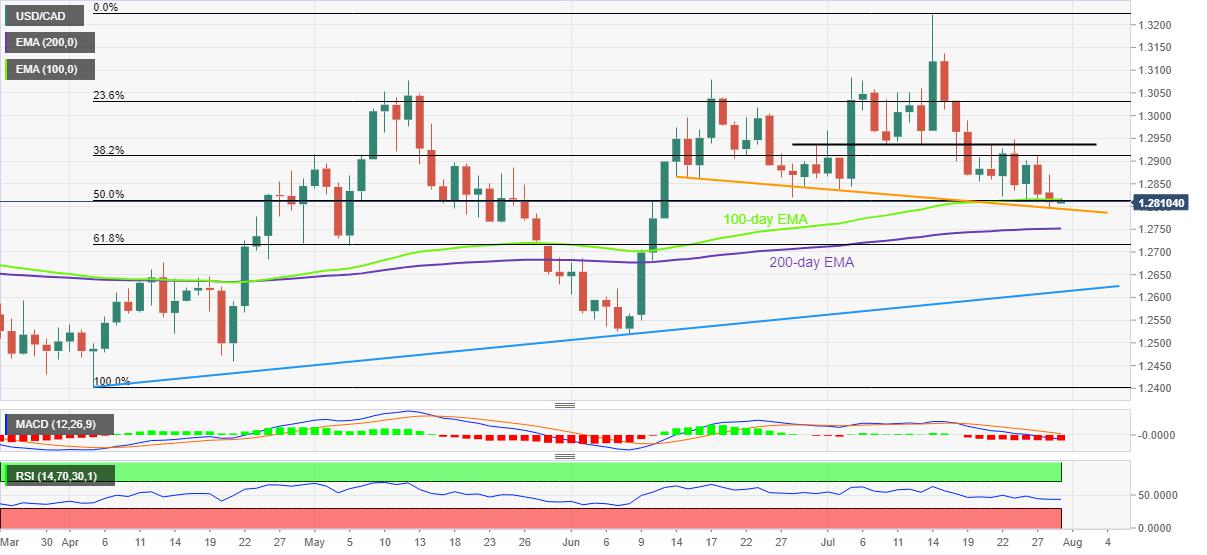
USD/CAD stays depressed around a seven-week low near 1.2800 during Friday’s Asian session. In doing so, the Loonie pair sellers keep reins around the short-term key support line.
It’s worth noting, however, that the quote’s first daily closing below the 100-day EMA since early June joins the downbeat RSI (14), not oversold, as well as bearish MACD signals, to hint at the pair’s further declines.
Hence, the USD/CAD bears await a clear downside break of the descending support line from June 14, at 1.2790 by the press time, to excel.
Following that, the 200-day EMA level near 1.2750 and the 61.8% Fibonacci retracement of April-July upside, near 1.2715, will be in focus before directing the sellers towards a three-month-long support line, near 1.2615 at the latest.
On the contrary, a confluence of the 100-day EMA and 50% Fibonacci retracement level guards the quote’s recovery moves around 1.2815.
Also acting as a strong upside hurdle for the USD/CAD buyers is a horizontal area established from June 30, close to 1.2940.
USD/CAD: Daily chart
Trend: Further weakness expected
Reprinted from FXStreet_id,the copyright all reserved by the original author.
Disclaimer: The content above represents only the views of the author or guest. It does not represent any views or positions of FOLLOWME and does not mean that FOLLOWME agrees with its statement or description, nor does it constitute any investment advice. For all actions taken by visitors based on information provided by the FOLLOWME community, the community does not assume any form of liability unless otherwise expressly promised in writing.
FOLLOWME Trading Community Website: https://www.followme.com


Hot
No comment on record. Start new comment.