USD/JPY Price Analysis: Falls but remains steady around 127.80s

- The USD/JPY is almost flat in the day, down a minimal 0.01%.
- An upbeat market mood and higher US Treasury yields put a lid on the USD/JPY fall.
- USD/JPY Price Forecast: The bias is neutral-upwards, but a break below 126.90, could open the door for further losses.
The USD/JPY edges lower and records minimal losses of 0.01% in the North American session, courtesy of a positive mood and a weaker greenback. At the time of writing, the USD/JPY is trading at 127.84.
Sentiment remains upbeat, as US equities gain between 1.27% and 1.90%. The US Dollar Index, a gauge of the greenback’s value vs. a basket of peers, is down 0.87% and clings to the 102.000 mark, a headwind for the USD/JPY. However, rising US Treasury yields put a lid on the fall, as the 10-year Treasury yield is rising almost seven basis points, sitting at 2.853%.
In the FX space, the risk appetite keeps safe-haven peers downward pressured and risk-sensitive currencies like the AUD, the NZD, and the GBP, up.
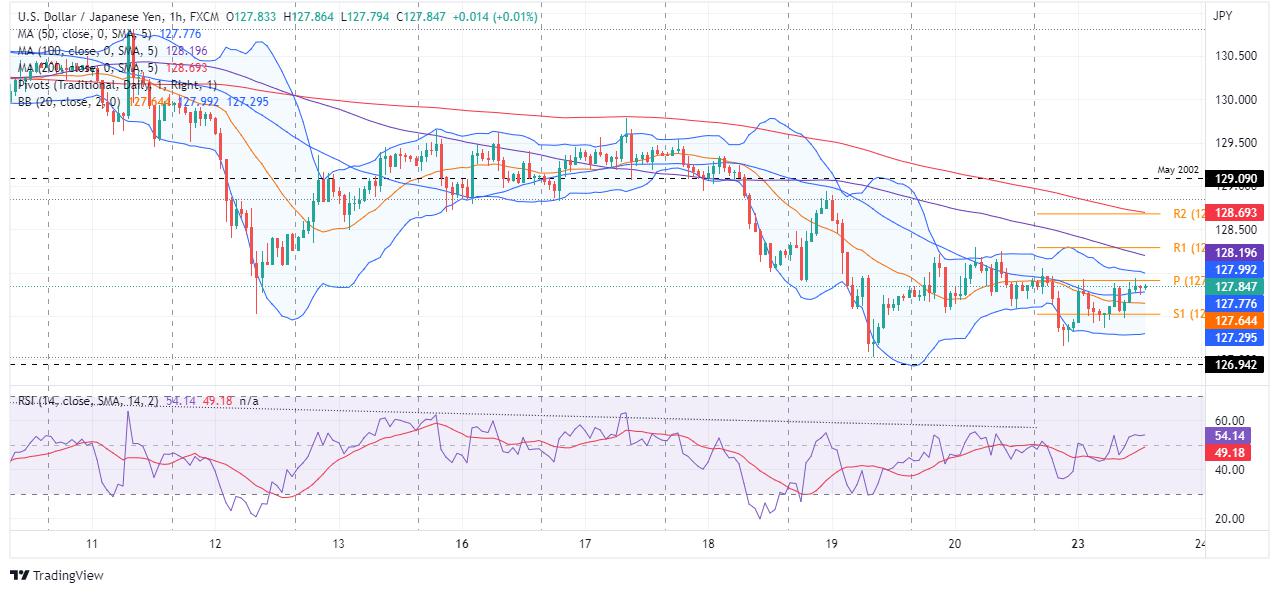
On Monday, in the Asian session, the USD/JPY opened near the daily pivot point at 127.90. However, the pair dipped below the S1 pivot at 127.31, towards the daily lows at around 127.15. Nevertheless, the major bounced off the lows during the European session and printed the daily high at 127.85.
USD/JPY Price Forecast: Technical outlook
The USD/JPY remains neutral-upward biased from a daily chart perspective, albeit approaching April’s 26 swing lows at around 126.94, was unable to break support. Nevertheless, the pair could shift its bias to neutral if USD/JPY bulls fail to break the 20-DMA at 129.23, exposing the major to selling pressure.
The USD/JPY 1-hour chart shows that the pair is trapped between the 50 and 100-hour simple moving averages (SMAs) at 127.98 and 128.19, respectively, but it is upwards. Why? The 20-hour SMA resides below the exchange rate, while the Relative Strength Index (RSI) shifted bullish above the 50-midline. Therefore, the USD/JPY bias is upwards.
The USD/JPY’s first resistance would be the daily pivot at 127.90. Latter’s breach would send the pair above the 128.00 mark and aim towards the 100-hour SMA at 128.19. Once cleared, the next resistance would be the R1 pivot point at 128.28, followed by the confluence of the 200-hour SMA and the R2 pivot point at 128.67.
Key Technical Levels
Reprinted from FXStreet_id,the copyright all reserved by the original author.
Disclaimer: The content above represents only the views of the author or guest. It does not represent any views or positions of FOLLOWME and does not mean that FOLLOWME agrees with its statement or description, nor does it constitute any investment advice. For all actions taken by visitors based on information provided by the FOLLOWME community, the community does not assume any form of liability unless otherwise expressly promised in writing.
FOLLOWME Trading Community Website: https://www.followme.com


Hot
No comment on record. Start new comment.