EUR/USD: Ukraine risks prevail, bears eye a move lower to test 1.0950 despite the ECB

- EUR/USD is under pressure despite a surprise outcome at the ECB.
- Ukraine crisis and central bank divergences weighing on the single currency.
- 1.0950 could be on the cards for the sessions ahead.
EUR/USD continues to bleed out in the aftermath of critical events including the European Central Bank's announcement, the US Consumer Price Index and the latest developments in the Ukraine crisis. At the time of writing, EUR/USD is trading at 1.0988 and is down some 0.78% on the day.
The ECB stated that it will phase out its stimulus in the third quarter, leaving the door open to an interest rate hike before the end of 2022. While this initially sent the euro higher, bears were quick to move in and bulls to take profits considering the calamity occurring at the borders of the EU.
Nevertheless, despite the fog of war, the ECB took more decisive actions than expected. ''The cautiously hawkish recalibration of APP shows that the ECB will not lose sight of inflation,'' analysts at Rabobank explained.
''The inflation forecast has been revised up significantly, but the ECB seems to underestimate the potential adverse impact on growth. Today’s adjustments reduce the risk somewhat that an economic downturn hits before the ECB can exit its asset purchases and implement the first-rate hike.''
In more detail, the analysts explained that the ''APP taper has been accelerated to €40bn in April, €30bn in May and €20bn in June. The ECB signalled that purchases could end in Q3 already, but remains fully data-driven. Policy rates will be hiked ‘some time’ after the end of net purchases, rather than ‘shortly’ after. Moreover, the ECB signals that the hiking cycle will be gradual.''
Meanwhile, the euro touched a 22-month low of $1.0804 earlier in the week, with investors expecting the crisis in Ukraine to have a sizeable impact on European growth. In light of that, there is no let-up in sight to the war and the euro would be expected to be a fade on rallies, especially against commodity-linked currencies and the greenback.
No sign of a cease-fire
In recent news, the foreign ministers of Ukraine and Russia failed to reach peace during the highest-level meeting in three weeks of war Thursday. The bombardment and airstrikes continued to devastate the city of Mariupol.
Both Ukraine’s Dmytro Kuleba and Russian counterpart Sergei Lavrov made clear in duelling news conferences after the face-to-face, that they had made no progress. The Ukrainian tweeted that his counterpart “seemed to have come to talk, not to decide.” “They seek Ukraine’s surrender. This is not going to happen,” Kuleba said.
This leaves the ECB trailing other major central banks such as the US Federal Reserve and the Bank of England in the post-pandemic tightening cycle. Both the BoE and Fed will meet next week and after today's US CPI, the Fed is sure to raise rates by at least 25 basis points.
Inflation data in the US on Thursday surged by 7.9% year-over-year in February, culminating in the largest annual increase in 40 years, data showed. As a consequence, the dollar index (DXY) moved up by over 0.50% to 98.512 following the report, after falling 1.17% on Wednesday.
EUR/USD H1 chart
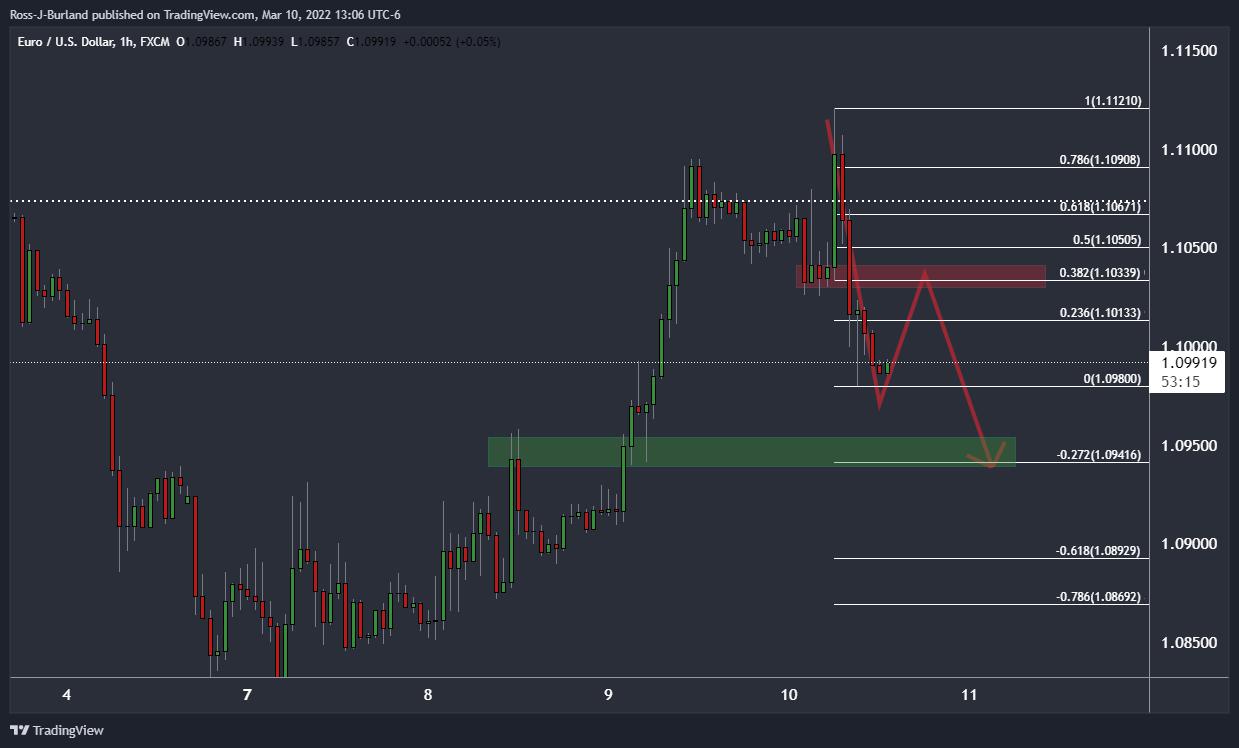
EUR/USD is showing some signs of deceleration on the hourly chart. The price could be on the verge of a meanwhile bullish correction, back to retest the old lows that would be expected to act as resistance. Should the bears move in at that juncture, enthused by a 38.2% Fibonacci retracement, then the price would stand a strong probability of continuing to the downside towards 1.0950 in an extension of the sell-off.
Reprinted from FXStreet_id,the copyright all reserved by the original author.
Disclaimer: The content above represents only the views of the author or guest. It does not represent any views or positions of FOLLOWME and does not mean that FOLLOWME agrees with its statement or description, nor does it constitute any investment advice. For all actions taken by visitors based on information provided by the FOLLOWME community, the community does not assume any form of liability unless otherwise expressly promised in writing.
FOLLOWME Trading Community Website: https://www.followme.com


Hot
No comment on record. Start new comment.