AUD/USD Price Analysis: Slips below 0.7100 inside monthly falling channel

- AUD/USD refreshes intraday low as sellers attack round figure within bearish chart pattern.
- Sellers stay hopeful as MACD teases bears, RSI retreats.
- Key SMAs, Fibonacci retracements add to the upside filters.
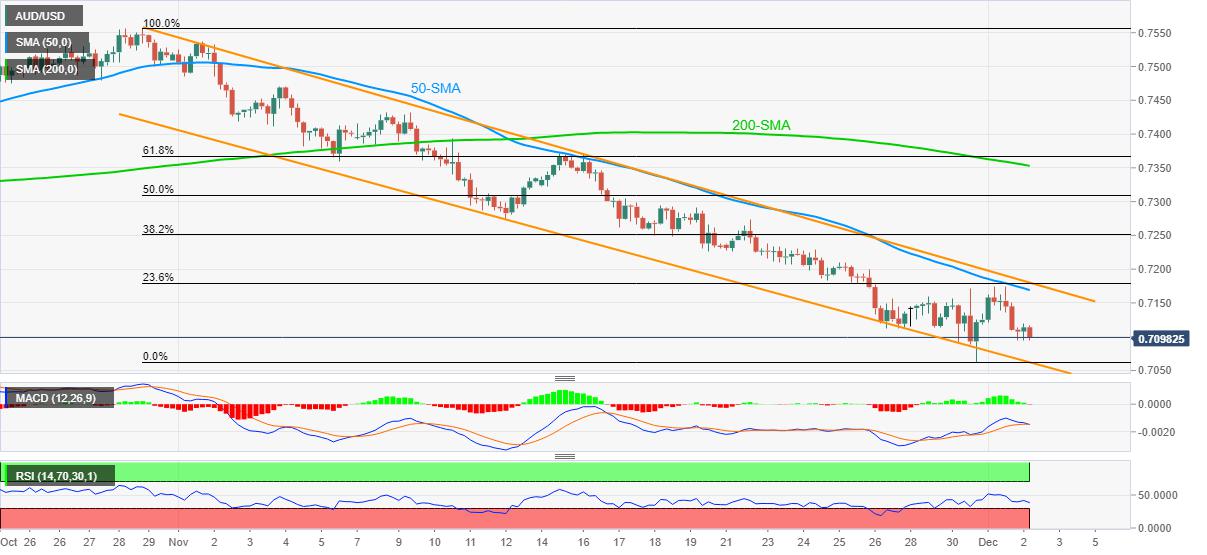
AUD/USD remains on the back foot around an intraday low of 0.7094, reversing early Asian gains ahead of Thursday’s European session.
In doing so, the Aussie stays within a one-month-old descending trend channel bearish formation. Also adding strength to the downside bias is the MACD line’s recent bear cross and the RSI retreat.
However, the lower line of the stated channel and the yearly low flashed at the end of November, around 0.7060, becomes a tough nut to crack for the AUD/USD sellers.
During the quote weakness past 0.7060, the 0.7000-6990 region comprising multiple levels marked since June 2020 will be the key to watch.
On the flip side, 50-SMA and 23.6% Fibonacci retracement (Fibo.) of late October to November downside, around 0.7175-80, challenge short-term buyers.
Even if the AUD/USD prices rally beyond 0.7180, the stated channel’s resistance line near 0.7190 and the 0.7200 threshold can challenge the bulls before directing them to 200-SMA and 61.8% Fibo., close to 0.7355 and 0.7370 in that order.
AUD/USD: Four-hour chart
Trend: Further weakness expected
Reprinted from FXStreet_id,the copyright all reserved by the original author.
Disclaimer: The content above represents only the views of the author or guest. It does not represent any views or positions of FOLLOWME and does not mean that FOLLOWME agrees with its statement or description, nor does it constitute any investment advice. For all actions taken by visitors based on information provided by the FOLLOWME community, the community does not assume any form of liability unless otherwise expressly promised in writing.
FOLLOWME Trading Community Website: https://www.followme.com


Hot
No comment on record. Start new comment.