WTI Price Analysis: Firmer inside immediate triangle around $70.00

- WTI pares intraday gains, holds onto Monday’s recovery moves.
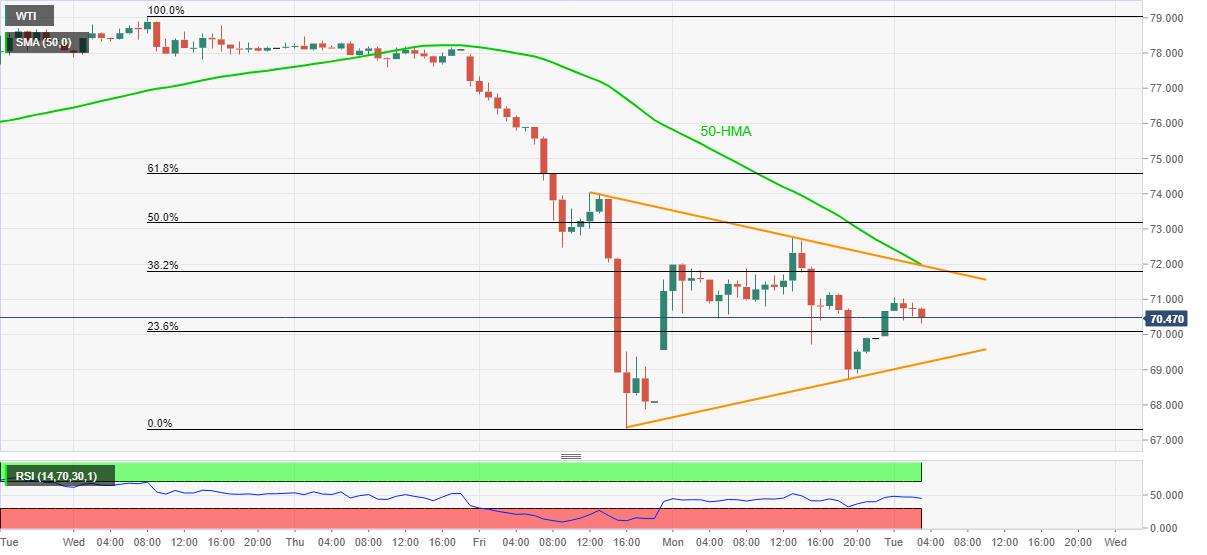
- 50-HMA, triangle resistance restricts immediate upside, RSI retreat teases sellers.
- Bulls need validation from $74.00 even if after crossing triangle’s resistance.
WTI crude oil retreats to $70.40 during a two-day rebound amid early Tuesday. While a two-day-old symmetrical triangle restricts the black gold’s recent moves, RSI pullback and addition of the 50-HMA to upside hurdle keep sellers hopeful.
However, a clear downside break of the stated triangle’s support line, near $69.20 by the press time, becomes necessary for the oil sellers to retake controls.
Following that, Friday’s low near $68.30 will gain the market’s attention before directing WTI bears to September’s low near $67.00 and July’s bottom close to $65.00.
On the flip side, the commodity’s advances will have a tough nut to crack around $72.00, comprising the triangle’s resistance line and 50-HMA.
Even if the quote manages to cross the $72.00, late Friday’s swing high near $74.00 may offer an additional filter before assuring the oil’s run-up towards $77.60, encompassing November 25 upside.
WTI: Hourly chart
Trend: Pullback expected
Reprinted from FXStreet_id,the copyright all reserved by the original author.
Disclaimer: The content above represents only the views of the author or guest. It does not represent any views or positions of FOLLOWME and does not mean that FOLLOWME agrees with its statement or description, nor does it constitute any investment advice. For all actions taken by visitors based on information provided by the FOLLOWME community, the community does not assume any form of liability unless otherwise expressly promised in writing.
FOLLOWME Trading Community Website: https://www.followme.com


Hot
No comment on record. Start new comment.