US Dollar Index Price Analysis: Correction lower could visit the 95.00 zone

- DXY adds to the rejection from recent new cycle tops.
- The 95.00 neighbourhood seen holding the downside.
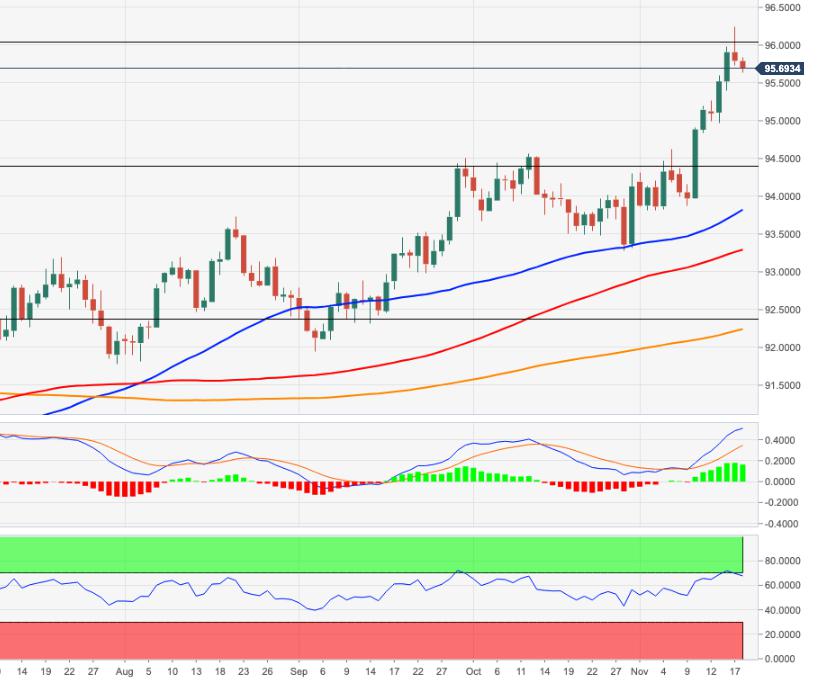
DXY retreats for the second session in a row and returns to the sub-96.00 area on Thursday.
A deeper knee-jerk looks plausible in light of the recent strong advance. There is a temporary support at the 10-day SMA at 95.03 which reinforces the weekly low at 94.96 (November 15). This area is forecast to initially hold further bearish attempts in the near term.
Looking at the broader picture, the constructive stance on the index is seen intact above the 200-day SMA at 92.24.
DXY daily chart
Reprinted from FXStreet_id,the copyright all reserved by the original author.
Disclaimer: The content above represents only the views of the author or guest. It does not represent any views or positions of FOLLOWME and does not mean that FOLLOWME agrees with its statement or description, nor does it constitute any investment advice. For all actions taken by visitors based on information provided by the FOLLOWME community, the community does not assume any form of liability unless otherwise expressly promised in writing.
FOLLOWME Trading Community Website: https://www.followme.com


Hot
No comment on record. Start new comment.