EUR/JPY Price Analysis: Struggles at 130.00, bears attack the 129.00 region

- EUR/JPY is flat as the Asian Pacific session begins, near Wednesday’s low around the 129.20s.
- EUR/JPY: Broke below a descending channel, accelerating the downtrend towards 129.00.
- EUR/JPY: A break below 129.00 could pave the way for a deeper correction, firstly 128.00, followed by 126.00.
The EUR/JPY is subdued as the Asian session begins, flat trading at 129.21 during the day at the time of writing.
On Wednesday, during the overnight session, the shared currency failed to break above the 50-hour simple moving average (HSMA). It also broke below the bottom-trendline of a descending channel, accelerating the downtrend, dropping 100 pips throughout the day, reaching a low around the 129.00 flat.
EUR/JPY Price Analysis: Technical outlook
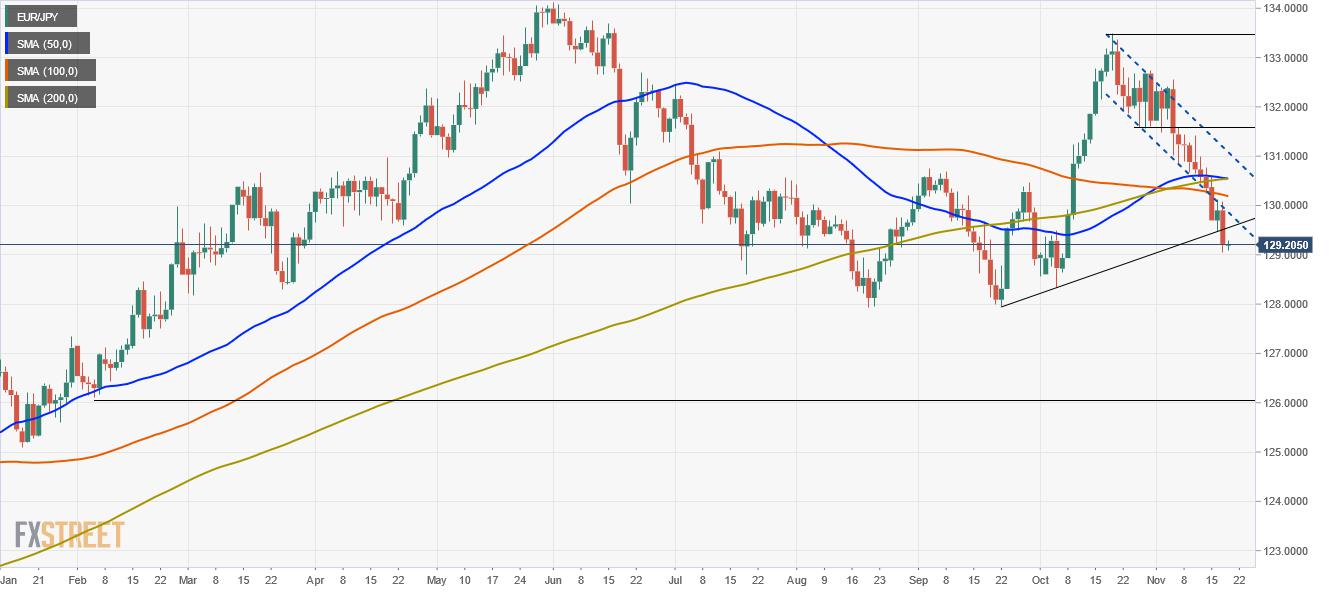
The daily chart depicts that the EUR/JPY pair broke below the descending channel, which seemed to be a bullish flag. However, once the spot price broke the bottom-trendline, it negated the validity of the pattern. Additionally, it broke a four-week upward trendline, cementing the downward bias in the pair.
Further, the 50-day moving average (DMA) just crossed under the 200-DMA, forming a death-cross usually viewed as a bearish signal.
If EUR/JPY sellers want to accelerate the downtrend, they will need to break below the October 6 low at 128.33. A breach of the latter would expose key support levels, like 128.00, followed by the February 4 low at 126.10.
On the flip side, if EUR buyers would like to reclaim control, they would need a daily close above the 100-DMA at 130.19. In that outcome, the following supply zone would be the convergence of the 50 and the 200-DMA around the 130.50-60 area.
Reprinted from FXStreet_id,the copyright all reserved by the original author.
Disclaimer: The content above represents only the views of the author or guest. It does not represent any views or positions of FOLLOWME and does not mean that FOLLOWME agrees with its statement or description, nor does it constitute any investment advice. For all actions taken by visitors based on information provided by the FOLLOWME community, the community does not assume any form of liability unless otherwise expressly promised in writing.
FOLLOWME Trading Community Website: https://www.followme.com


Hot
No comment on record. Start new comment.