Gold Price Forecast: XAU/USD bulls look to $1,800 on falling wedge breakout, US PMI eyed

- Gold stays on the front foot after confirming bullish chart pattern.
- Softer USD, stimulus hopes battle risks emanating from China, Evergrande to favor buyers.
- US ISM Services PMI for September becomes the key ahead of NFP.
- Gold Price Forecast: Bulls challenging Fibonacci resistance
Gold (XAU/USD) holds the head high at around $1,770 during a four-day uptrend to Tuesday’s Asian session. The yellow metal cheers US dollar weakness to consolidate September’s losses while confirming a bullish chart pattern to aim for the key short-term hurdle near the $1,800 threshold.
US Dollar Index (DXY) began the week with the same old pullback moves and dropped for the third consecutive day to settle around 93.00 by the end of Monday’s New York.
While the risk-off mood and the Fed tapering chatters are still on the table, off in China and market’s search for fresh clues, as well as lack of clarity over the US stimulus and debt ceiling extension, seemed to have underpinned the DXY pullback and gold recovery moves.
Market sentiment soured as the age-old US-China tensions got an additional push after America condemned Chinese activity near Taiwan. Adding to the chapter are the comments from US Trade Representative (USTR) Katherine Tai who cited Beijing’s shortfall in meeting the phase one deal targets.
Additionally, trading suspension of the Evergrande stock in Hong Kong triggered chatters that the struggled real estate is up for selling property to pay for the debt.
In the US, Republicans rejected the Democratic push for a bipartisan agreement on the infrastructure stimulus bill and debt ceiling extension. The policymakers have until October 18, per Treasury Secretary Janet Yellen before witnessing empty pockets and fears for government offices.
It’s worth noting that the Fed tapering chatters are likely to have lost the importance of late and hence failed to underpin the US dollar even as the policymakers are optimistic. The same help gold to extend the recovery moves.
Against this backdrop, Wall Street closed in red and the US 10-year Treasury yields inched up but the US Dollar Index (DXY) remained pressured for the third consecutive day. Further, the S&P 500 Futures begin Tuesday’s trading with mild gains at the latest.
Looking forward, the US ISM Manufacturing PMI and final reading of Markit PMI for September will be important to watch for fresh impulse but the headlines concerning China and Evergrande shouldn’t be missed.
Read: US September ISM Services PMI Preview: Eyes on inflation and employment details
Technical analysis
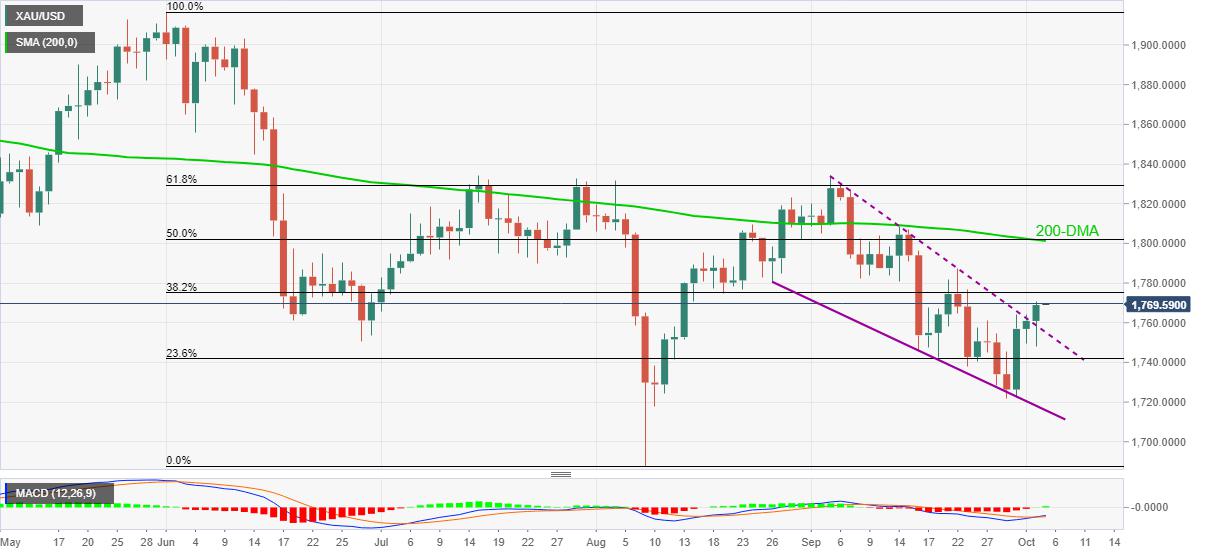
Gold stays firmer after confirming a five-week-old falling wedge bullish chart pattern following a hawkish start to the key week.
Given the MACD line’s ability to offer a bullish cross, coupled with the confirmation of the bullish formation, gold buyers are likely to attempt power play and aim for the late September peak surrounding $1,787.
It’s worth noting that a convergence of 200-DMA and 50% Fibo. near $1,802 will be a tough nut to crack for gold buyers, a break of which won’t hesitate to challenge the $1,834 ‘double tops’.
Alternatively, pullback moves may aim for 23.6% Fibonacci retracement (Fibo.) of June-August downside, around $1,741 but the support line of the stated formation near $1,718 will challenge any further weakness of the gold prices.
In a case where gold bears keep reins past $1,718, the $1,700 threshold will test them ahead of the yearly bottom surrounding $1,687.
Gold: Daily chart
Trend: Pullback expected
Reprinted from FXStreet_id,the copyright all reserved by the original author.
Disclaimer: The content above represents only the views of the author or guest. It does not represent any views or positions of FOLLOWME and does not mean that FOLLOWME agrees with its statement or description, nor does it constitute any investment advice. For all actions taken by visitors based on information provided by the FOLLOWME community, the community does not assume any form of liability unless otherwise expressly promised in writing.
FOLLOWME Trading Community Website: https://www.followme.com


Hot
No comment on record. Start new comment.