US Dollar Index Price Analysis: DXY bounces off 10-week low towards previous hurdle

- DXY consolidates the heaviest drop in six months.
- Sustained break of the key support line, now resistance, joins bearish MACD to favor sellers.
- April low adds to the immediate upside hurdle, February’s bottom stays on seller’s radar.
Having recently dropped to the fresh low since February 26, the US dollar index (DXY) picks up bids to 90.23 amid Monday’s Asian session trading. In doing so, the greenback gauge snaps a three-day downtrend.
However, bearish MACD and Friday’s break of an ascending support line from January 06 keeps DXY sellers hopeful.
While the 90.00 threshold acts as immediate support, February’s low of 89.68 becomes the key for the US dollar sellers as a break of which may not hesitate to challenge the yearly bottom surrounding 89.20.
Alternatively, a clear upside break of the previous support line near 90.35 needs to cross April’s trough of 90.42 before convincing short-term buyers.
Though, the 91.00 threshold, a 21-day SMA level near 91.00 and a downward sloping trend line from March 31 close to 91.20 may challenge the DXY’s further upside.
DXY daily chart
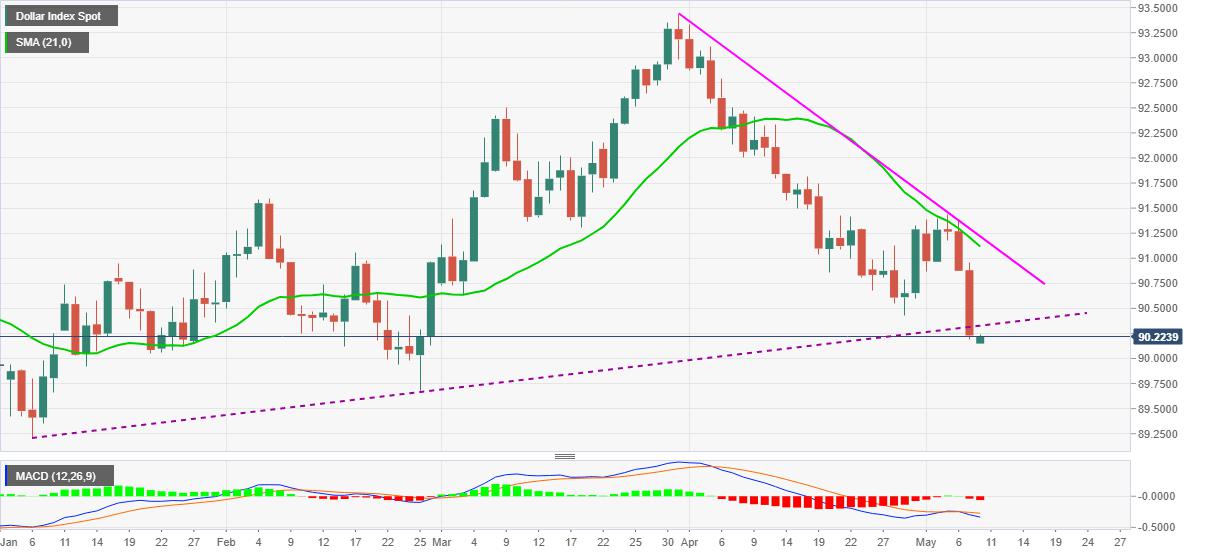
Trend: Bearish
Reprinted from FXStreet_id,the copyright all reserved by the original author.
Disclaimer: The content above represents only the views of the author or guest. It does not represent any views or positions of FOLLOWME and does not mean that FOLLOWME agrees with its statement or description, nor does it constitute any investment advice. For all actions taken by visitors based on information provided by the FOLLOWME community, the community does not assume any form of liability unless otherwise expressly promised in writing.
FOLLOWME Trading Community Website: https://www.followme.com


Hot
No comment on record. Start new comment.