Silver Price Analysis: XAG/USD inches closer to $25.35-40 confluence resistance

- Silver built on the previous day’s solid intraday bounce from over two-month lows.
- Mixed oscillators on hourly/daily charts warrant some caution for aggressive traders.
- A sustained move beyond the $24.40 supply zone is needed to confirm a bullish bias.
Silver showed some resilience below the very important 200-day SMA on Thursday and stage a solid intraday bounce from over two-month lows.
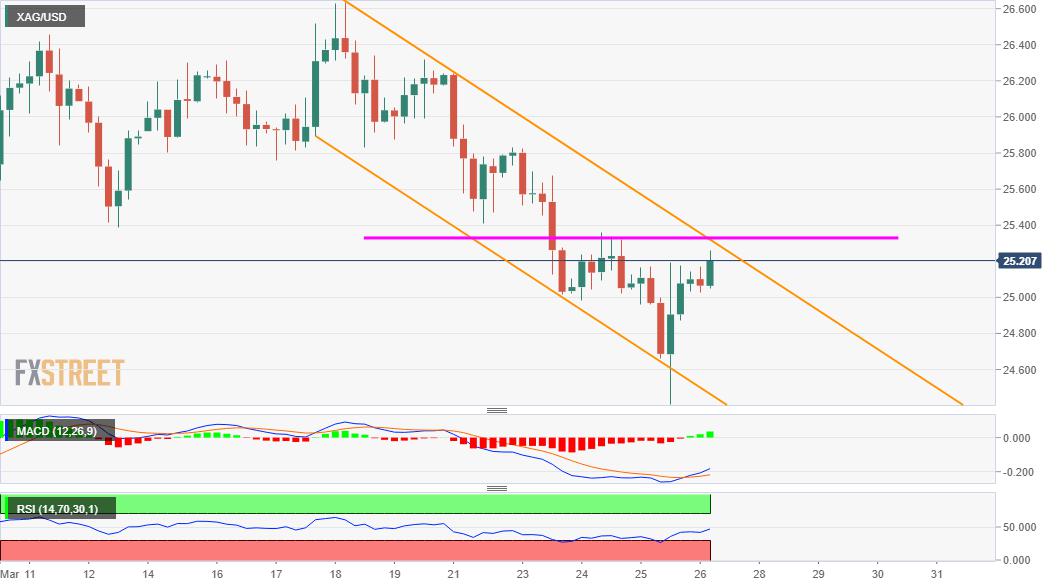
The recovery extended through the early part of the trading action on Friday and pushed the while metal towards the top end of a short-term descending channel. The XAG/USD was last seen trading around the $25.20 region, up 0.70% for the day.
Meanwhile, technical indicators on the 1-hourly chart have been gaining positive traction. However, bearish oscillators on 4-hourly/daily charts warrant some caution before positioning for any strong follow-through positive move.
Hence, any subsequent positive move is more likely to confront stiff resistance near the $25.35-40 supply zone. A sustained move beyond will mark a bullish breakout and prompt some aggressive short-covering move around the XAG/USD.
The commodity might then aim back to reclaim the $26.00 mark. The momentum could further get extended and push the commodity back towards the $26.40-50 supply zone, tested in the aftermath of the dovish FOMC statement last week.
On the flip side, the key $25.00 psychological mark now seems to protect the immediate downside. Failure to defend the mentioned support will shift the bias back in favour of bearish traders and turn the XAg/USD vulnerable.
The next relevant target on the downside is pegged near the $24.65 region (200-DMA), below which the XAG/USD could accelerate the fall towards challenging YTD lows, around the $24.00 mark touched on January 18.
XAG/USD 4-hourly chart
Technical levels to watch
Reprinted from FXStreet_id,the copyright all reserved by the original author.
Disclaimer: The content above represents only the views of the author or guest. It does not represent any views or positions of FOLLOWME and does not mean that FOLLOWME agrees with its statement or description, nor does it constitute any investment advice. For all actions taken by visitors based on information provided by the FOLLOWME community, the community does not assume any form of liability unless otherwise expressly promised in writing.
FOLLOWME Trading Community Website: https://www.followme.com


Hot
No comment on record. Start new comment.