EUR/USD Price Analysis: Daily chart shows failed breakout

- EUR/USD's daily chart shows a failed bullish breakout.
- The pair risks falling to support below 1.17.
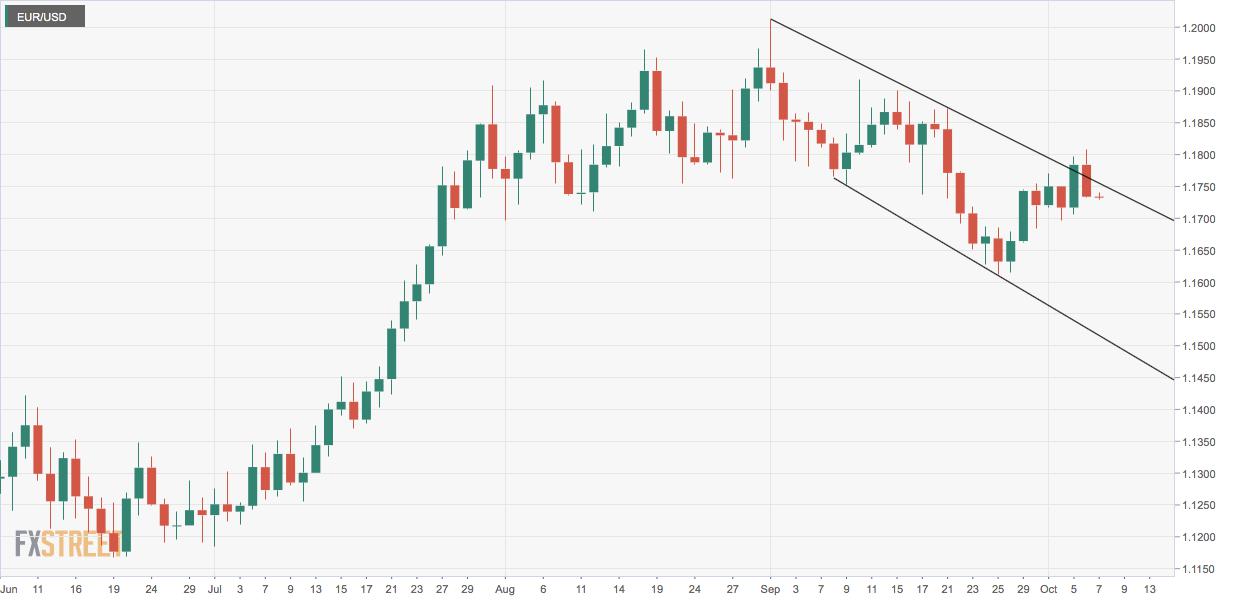
EUR/USD fell 0.40% on Tuesday and closed back inside a falling channel represented by trendlines connecting Sept. 1 and Sept. 21 highs and Sept. 8 and Sept. 25 lows.
Essentially, the bearish channel breakout confirmed on Oct. 5 has been neutralized by Tuesday's decline.
Chart analysts consider failed breakouts as powerful bearish signals. As such, the currency pair now looks south and could test support at 1.1696 (Oct. 2 low).
Tuesday's high of 1.1808 is now the level to beat for the bulls. At press time, the pair is trading in a sideways manner near 1.1733.
Daily chart
Trend: Bearish
Technical levels
Reprinted from FXStreet,the copyright all reserved by the original author.
Disclaimer: The content above represents only the views of the author or guest. It does not represent any views or positions of FOLLOWME and does not mean that FOLLOWME agrees with its statement or description, nor does it constitute any investment advice. For all actions taken by visitors based on information provided by the FOLLOWME community, the community does not assume any form of liability unless otherwise expressly promised in writing.
FOLLOWME Trading Community Website: https://www.followme.com


Hot
-THE END-