历史总是惊人地相似?一图看懂:纳斯达克100指数泡沫或将破裂

 历史总是惊人地相似?一图看懂:纳斯达克100指数泡沫或将破裂
财联社(上海,编辑 黄君芝)讯,资管公司Mott Capital创始人及投资组合经理Michael Kramer日前在博客中发出一张“惊人的”图表,并称历史似乎在重演,美股未来的走势不妙。
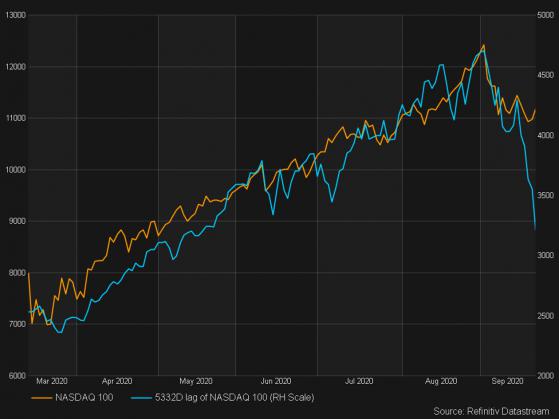
还记得1999年令人兴奋的互联网泡沫时期吗?当时疯狂的买盘推高了科技股的估值,而现如今许多科技股已近“死了”。然而,Kramer的图表显示,当前纳斯达克100指数的走势与1999年底网络泡沫时期高度相似。
“这十分令人震惊,”Kramer对投资者说:“顺便说一句,我希望这是错误的。但不仅仅是这张图,近期的一些数据也几乎完全反映了1999年的情况。”
他解释称,从今年3月份新冠疫情引发的低点开始,纳斯达克100指数在163天内上涨了84%。而该指数在从1999年11月到达顶峰的151天中上涨了约86%。股市“爆炸式上涨”的原因可能千差万别,但实际上这两次的走势确实非常相似。
“我不知道,也许只是偶然,但还是非常奇怪,我想我们很快就会发现相似之处是否就到此为止了。”他补充说。
事实上,纳斯达克100指数近期已经从9月2日高点下跌了13%,跌破50日均线,并且一年来首次跑输标普500指数。截至当地时间周三(23日)美股收盘,纳斯达克100指数跌3.16%,报10833.33点。
摩根士丹利(Morgan Stanley)首席美国股票策略师Mike Wilson日前也曾发出警告称,接下来可能还有更深程度的下跌,当前的下跌尚未扫除过去几个月历史性上涨行情中涌现的乐观情绪。
“以科技股为主的这个指数可能跌向200日均线。该均线目前接近9528点,较当前水平低12%,较本月初创下的历史新高12421点低23%。”他补充称。
Disclaimer: The content above represents only the views of the author or guest. It does not represent any views or positions of FOLLOWME and does not mean that FOLLOWME agrees with its statement or description, nor does it constitute any investment advice. For all actions taken by visitors based on information provided by the FOLLOWME community, the community does not assume any form of liability unless otherwise expressly promised in writing.
FOLLOWME Trading Community Website: https://www.followme.com


Hot
No comment on record. Start new comment.