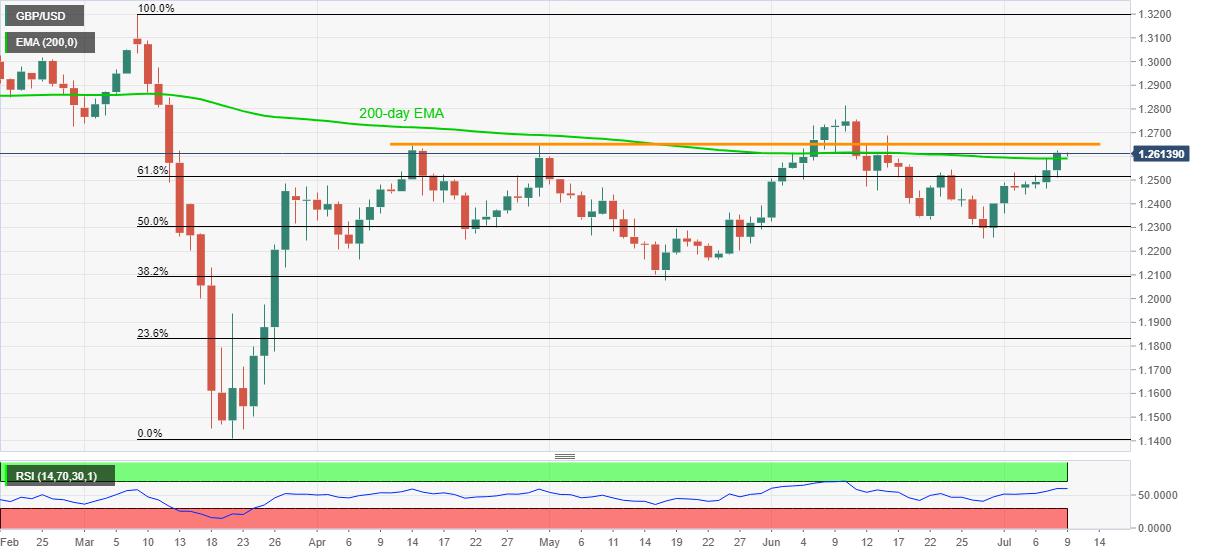
GBP/USD Price Analysis: Keeps break of 200-day EMA above 1.2600

- GBP/USD nears three-week top, recently bounced off 1.2600.
- A successful trading above the key EMA enables the quote to confront a three-month-old horizontal resistance.
- 61.8% Fibonacci retracement adds to the downside support.
GBP/USD remains on the front foot around 1.2613 during the early Asian session on Thursday. In doing so, the Cable keeps the previous day’s break above 200-day EMA. As a result, the bulls are targeting a horizontal area comprising multiple highs marked since April 14.
Other than the 1.2645/55 immediate resistance region, the early-June top of 1.2730 and 1.2800 round-figure may act as buffers ahead of the June 10 peak of 1.2813.
It’s worth mentioning that the pair’s rise past-1.2813 could aim for 1.3000 psychological magnet before refreshing the yearly top beyond 1.3200.
Meanwhile, a daily close below 200-day EMA level of 1.2590 could drag the quote to 61.8% of Fibonacci retracement of March month’s fall near 1.2515.
Also acting as the near-term key supports will be July 03 bottom near 1.2440 and June 22 low surrounding 1.2330.
GBP/USD daily chart
Trend: Bullish
Reprinted from FXStreet,the copyright all reserved by the original author.
Disclaimer: The content above represents only the views of the author or guest. It does not represent any views or positions of FOLLOWME and does not mean that FOLLOWME agrees with its statement or description, nor does it constitute any investment advice. For all actions taken by visitors based on information provided by the FOLLOWME community, the community does not assume any form of liability unless otherwise expressly promised in writing.
FOLLOWME Trading Community Website: https://www.followme.com


Hot
No comment on record. Start new comment.