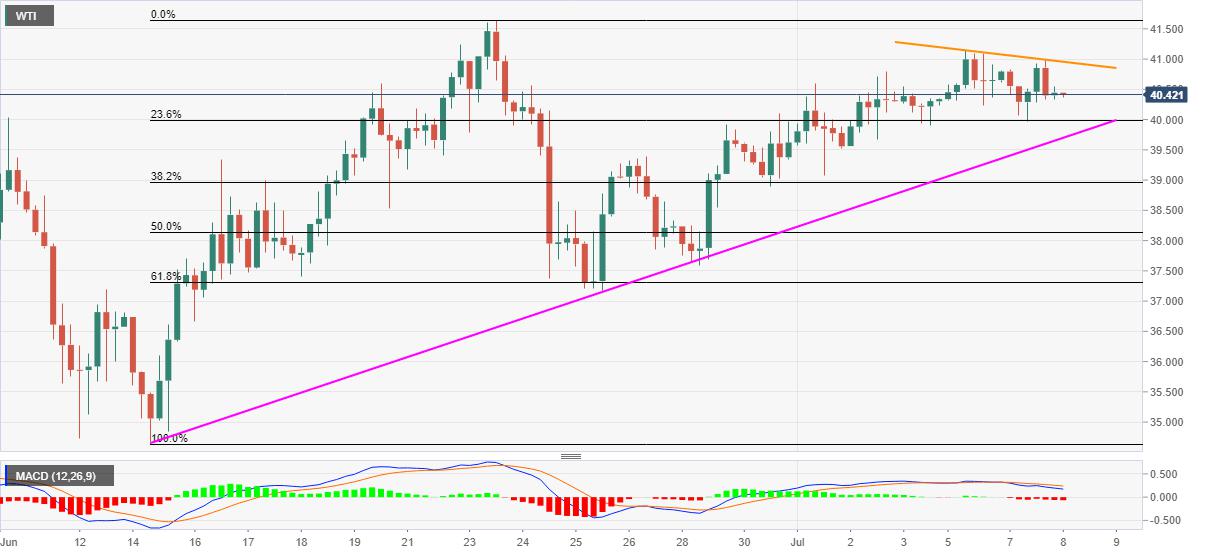
WTI Price Analysis: Fades upside momentum beyond $40.00

- WTI stays pressured after rising to two-week top the previous day.
- Immediate falling trend line, bearish MACD suggests further weakness.
- An upward sloping trend line from June 15 offers immediate support.
- Bulls will have to cross June month top to aim for February high.
WTI takes rounds to $40.50/40 as the Tokyo session opens for Wednesday. The energy benchmark repeated failures to cross $41.00 so far during the current week. In its latest attempt on Tuesday, the quote reversed from $40.99.
Considering the commodity’s inability to stay strong beyond $40.00, coupled with the bearish MACD signals, the sellers are likely to wait for an entry. As a result, a three-week-old support line, at $39.70, becomes the key to watch.
If at all the buyers get defeated with a price level below $39.70, June 24 top near $39.40 and 61.8% Fibonacci retracement level of June 15-23 rise, around $37.30, will return to the charts.
On the contrary, a clear break above the immediate resistance line, at $40.96 now, will need a sustained cross past-June month high of $41.65 to challenge February month low surrounding $44.00.
WTI four-hour chart
Trend: Pullback expected
Reprinted from FXStreet,the copyright all reserved by the original author.
Disclaimer: The content above represents only the views of the author or guest. It does not represent any views or positions of FOLLOWME and does not mean that FOLLOWME agrees with its statement or description, nor does it constitute any investment advice. For all actions taken by visitors based on information provided by the FOLLOWME community, the community does not assume any form of liability unless otherwise expressly promised in writing.
FOLLOWME Trading Community Website: https://www.followme.com


Hot
-THE END-