AUD/NZD Price Analysis: Depressed above 1.0600 inside falling triangle before RBA

- AUD/NZD stretches losses from 1.0656 to ignore the previous day’s recovery.
- The 1.0600 round-figures can offer intermediate halt ahead of the triangle’s support.
- 200-bar SMA adds strength to the upside barriers.
AUD/NZD prints 0.10% loss while declining to 1.0630 during Tuesday’s Asian session. Even so, the pair remains inside the monthly descending triangle formation, currently attacking the bottom. The pair traders are likely waiting for the Reserve Bank of Australia’s (RBA) monetary policy decision, up for publishing at 04:30 GMT, for fresh impulse.
Read: Reserve Bank of Australia Preview: Policymakers to remain cautiously optimistic
Considering the no rate change expectations from the RBA, coupled with likely upbeat tone based on the Australian dollar’s latest strength, the AUD/NZD prices may recover from the current levels.
Though, resistance line of the mentioned triangle, at 1.0690 now, followed by a 200-bar SMA level of 1.0700, could challenge the bulls afterward.
If at all the RBA’s anticipated optimism propels the quote beyond 1.0700, the June 24 uptick near 1.0790 and the previous month’s high near 1.0885 could lure the bulls.
On the downside, the pattern’s support line around 1.0580/75 is likely to restrict the pair’s near-term declines. However, a clear break of 1.0575 will extend the south-run towards the late-April low near 1.0470.
AUD/NZD four-hour chart
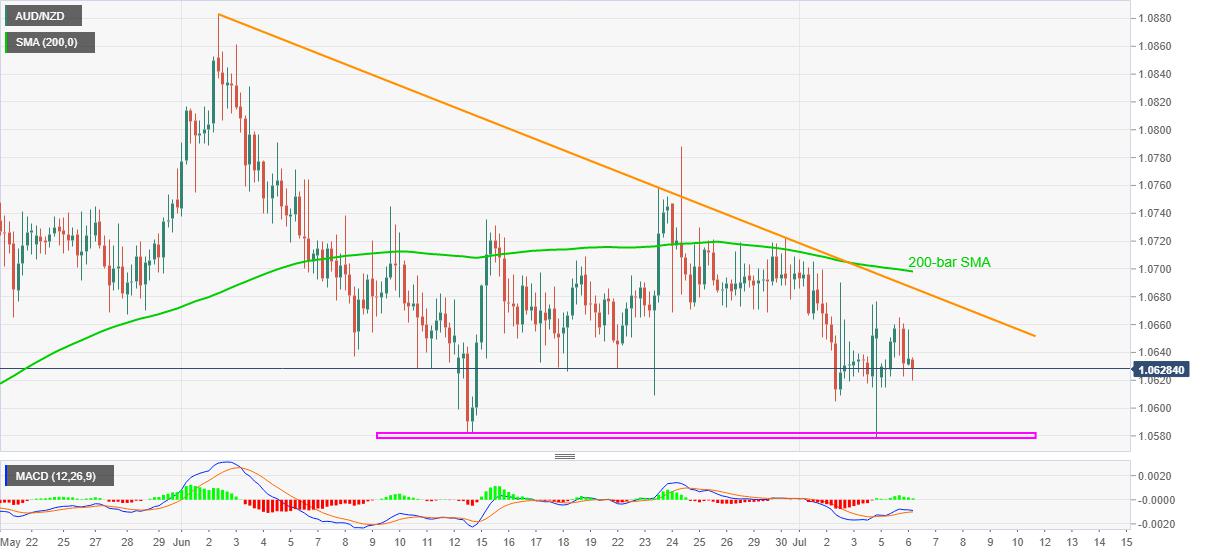
Trend: Sideways
Reprinted from FXStreet,the copyright all reserved by the original author.
Disclaimer: The content above represents only the views of the author or guest. It does not represent any views or positions of FOLLOWME and does not mean that FOLLOWME agrees with its statement or description, nor does it constitute any investment advice. For all actions taken by visitors based on information provided by the FOLLOWME community, the community does not assume any form of liability unless otherwise expressly promised in writing.
FOLLOWME Trading Community Website: https://www.followme.com


Hot
No comment on record. Start new comment.