USD/CAD Price Analysis: Depressed below weekly resistance line under 1.3600

- USD/CAD bounces off intraday low to snap the previous two-day losing streak.
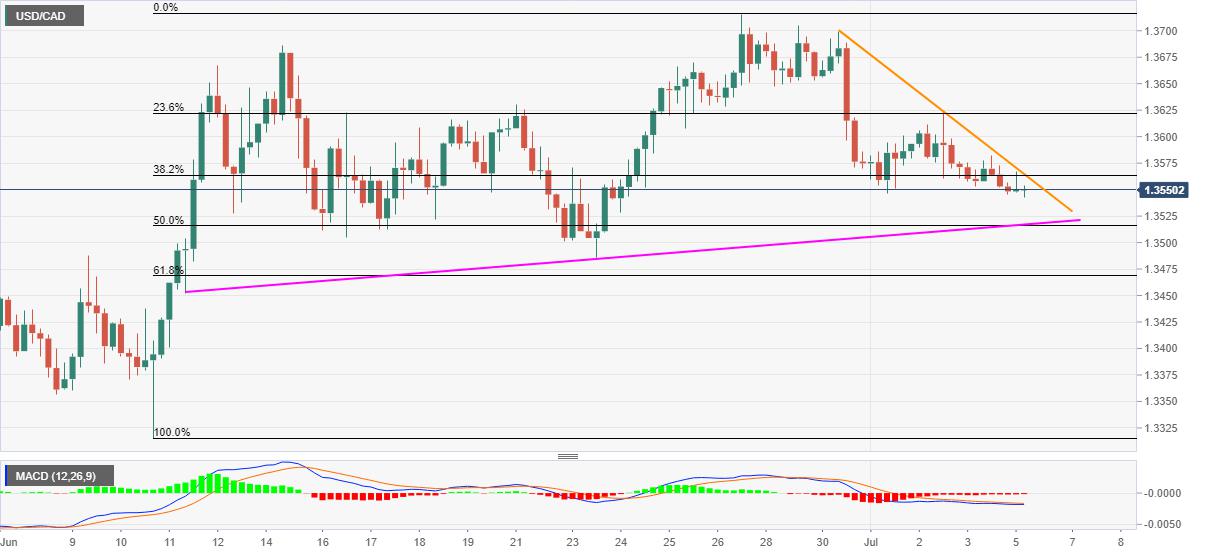
- 1.3520/15 becomes the tough nut to crack for sellers, bulls can pierce 1.3600 on the break the said trend line resistance.
- MACD teasing the bulls, 61.8% Fibonacci retracement adds to the downside support.
USD/CAD takes rounds to 1.3550, following its U-turn from intraday low of 1.3543, during the early Monday’s Asian session. With the recent bounce, the Loonie pair questions the previous two days’ declines amid MACD conditions suggesting further recoveries. However, a downward sloping trend line from June 30 guards the pair’s immediate upside.
Other than the 1.3565 immediate hurdle comprising the mentioned resistance line, 1.3630 and the mid-June top surrounding 1.3685 also question the bulls.
It should, however, be noted that the pair’s ability to cross 1.3685 can overcome the June month’s top near 1.3715 to attack the May 29 high near 1.3835/40.
On the contrary, a confluence of 50% Fibonacci retracement level of June 10-26 upside and a rising support line from June 11, around 1.3520/15, becomes strong support. If the sellers manage to sneak in around 1.3515, June 23 low near 1.3485 and 1.3468 mark comprising 61.8% Fibonacci retracement will be in the spotlight.
USD/CAD four-hour chart
Trend: Further recovery expected
Reprinted from FXStreet,the copyright all reserved by the original author.
Disclaimer: The content above represents only the views of the author or guest. It does not represent any views or positions of FOLLOWME and does not mean that FOLLOWME agrees with its statement or description, nor does it constitute any investment advice. For all actions taken by visitors based on information provided by the FOLLOWME community, the community does not assume any form of liability unless otherwise expressly promised in writing.
FOLLOWME Trading Community Website: https://www.followme.com


Hot
No comment on record. Start new comment.