GBP/USD Price Analysis: Seesaws around monthly low above 1.2300 amid oversold RSI conditions

- GBP/USD fails to extend the late-Friday pullback from the lowest since May 29.
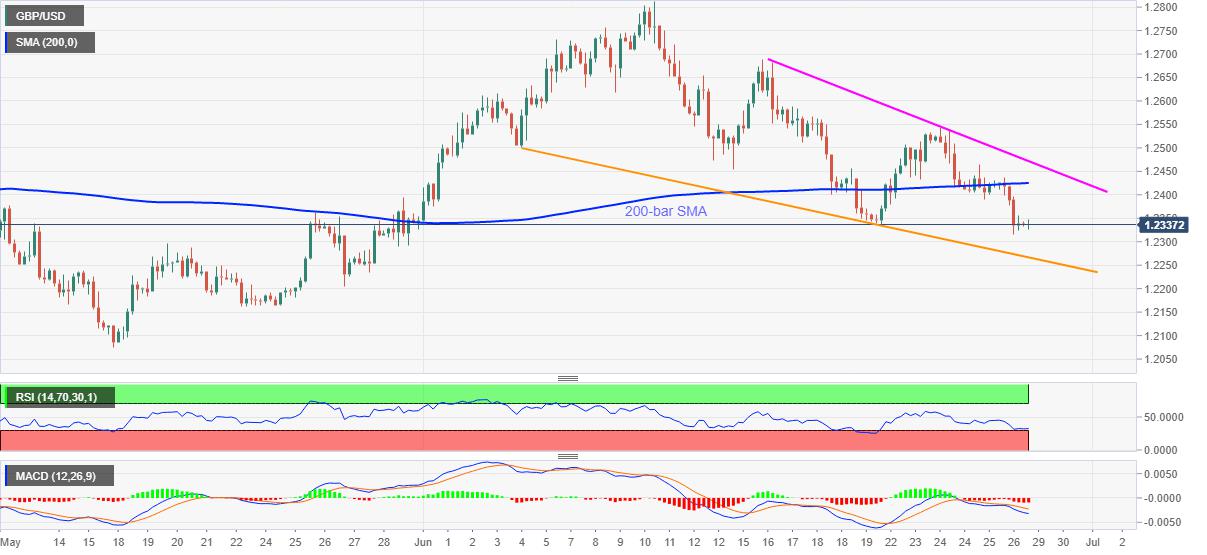
- A descending trend line from June 04 stays on the bears’ radars below 200-bar SMA.
- Oversold RSI conditions confront bearish MACD signals ahead of the key EU-UK Brexit talks.
GBP/USD drops to 1.2335 during the initial Asian session on Monday. The Cable refreshed the monthly low while declining to 1.2315, lowest since May 29, on Friday. However, the follow-on short-covering propelled the quote to 1.2355 levels amid oversold RSI conditions.
However, bearish MACD continues to portray the pair’s weakness below 200-bar SMA, which in turn directs sellers towards a short-term falling support line, at 1.2266 now. Though, the pair’s further downside could be challenged by May 27 low near 1.2200.
Meanwhile, a clear break of 200-bar SMA, at 1.2425 now, will have to cross a two-week-old falling resistance line, currently near 1.2475, to justify the momentum strength. In doing so, the GBP/USD prices may target June 24 top near 1.2545 in an extended recovery.
Other than the technical signals, the GBP/USD traders should be cautious ahead of the key Brexit talks between the UK and the European Union (EU) policymakers. Both the sides have recently agreed to faster the post-divorce trade deal talks. Though, there are many twists in the tale that could entertain the pair watchers.
GBP/USD four-hour chart
Trend: Bearish
Reprinted from FXStreet,the copyright all reserved by the original author.
Disclaimer: The content above represents only the views of the author or guest. It does not represent any views or positions of FOLLOWME and does not mean that FOLLOWME agrees with its statement or description, nor does it constitute any investment advice. For all actions taken by visitors based on information provided by the FOLLOWME community, the community does not assume any form of liability unless otherwise expressly promised in writing.
FOLLOWME Trading Community Website: https://www.followme.com


Hot
No comment on record. Start new comment.