GBP/USD Price Analysis: Probes short-term resistance line following Thursday’s Doji

https://www.fxstreet.com/news/...
- GBP/USD holds onto recovery gains from 1.2389.
- Bullish candlestick near four-day low, normal RSI favor further recovery.
- 50-day and 100-day EMAs offer additional upside barriers.
- Monthly low offers strong support under 1.2400.
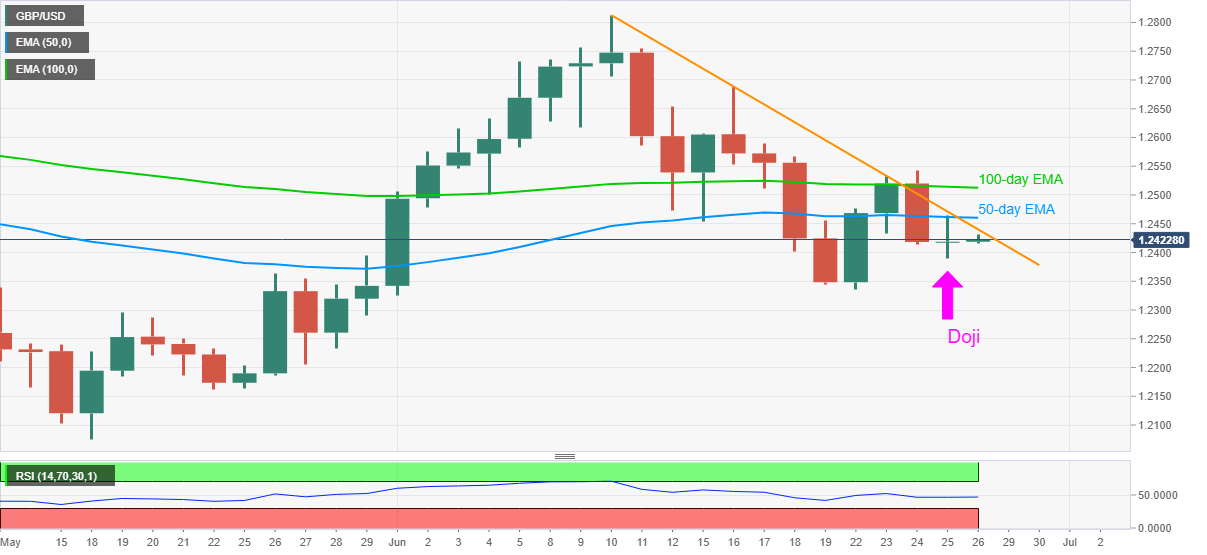
GBP/USD recedes from the intraday high of 1.2430 to 1.2421 as Tokyo opens for trading on Friday. Even so, the Cable carries the previous day’s pullback to near a descending resistance line while justifying the bullish Doji formation on the daily chart.
Considering the pair’s U-turn backed by normal RSI conditions, the quote might cross the nearby upside barrier, at 1.2440 now. However, 50-day EMA, at 1.2460, could challenge the further upside.
In a case where the bulls dominate past-1.2460, a 10-day EMA level of 1.2512 and Wednesday’s top near 1.2545 could flash on their radars.
Alternatively, the pair’s declines below Thursday’s low of 1.2389 could again attack the monthly bottom surrounding 1.2325 and May 19 top near 1.2300.
GBP/USD daily chart
Trend: Further recovery expected
Reprinted from FX Street. The Copyright all reserved by the original author.
Disclaimer: The content above represents only the views of the author or guest. It does not represent any views or positions of FOLLOWME and does not mean that FOLLOWME agrees with its statement or description, nor does it constitute any investment advice. For all actions taken by visitors based on information provided by the FOLLOWME community, the community does not assume any form of liability unless otherwise expressly promised in writing.
FOLLOWME Trading Community Website: https://www.followme.com


Hot
-THE END-