GBP/USD Price Analysis: Bears attack 14-day low after breaking three-month-old support line, 50-day SMA

- GBP/USD stays on the back foot near the lowest since June 01.
- A sustained break of key support line, now resistance, as well as 50-day SMA, keep sellers hopeful.
- 61.8% Fibonacci retracement adds to the upside barrier.
GBP/USD declines to 1.2413, down 0.09% on a day, amid the early Tokyo session on Friday. In doing so, the Cable remains near the previous day’s low, the bottom of the month, while also flashing a four-day losing streak.
The reasons supporting the pair’s latest weakness could be traced from its sustained break of an ascending trend line from March 20, backed by extended fall under 50-day SMA.
Hence, the sellers currently aiming to refresh the monthly low around 1.2330/25. Though, 50% Fibonacci retracement level of March month downside, close to 1.2300, could challenge the bears afterward, if not then the odds of its further downside towards the May month low near 1.2075 can’t be ruled out.
Meanwhile, the pair’s rise past-50-day SMA level of 1.2430 will need to pierce the support-turned-resistance, at 1.2465 now, to question 61.8% Fibonacci retracement level of 1.2515.
During the pair’s recoveries beyond 1.2515, a one-week-old falling trend line near 1.2585 and the weekly top close to 1.2690 might lure the bulls.
GBP/USD daily chart
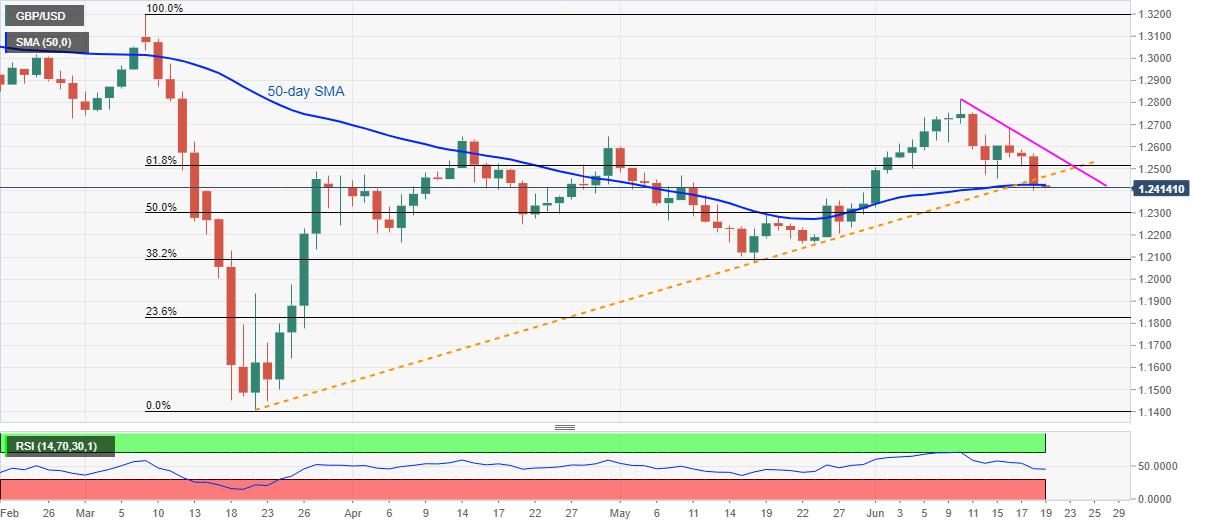
Trend: Bearish
Reprinted from FXStreet,the copyright all reserved by the original author.
Disclaimer: The content above represents only the views of the author or guest. It does not represent any views or positions of FOLLOWME and does not mean that FOLLOWME agrees with its statement or description, nor does it constitute any investment advice. For all actions taken by visitors based on information provided by the FOLLOWME community, the community does not assume any form of liability unless otherwise expressly promised in writing.
FOLLOWME Trading Community Website: https://www.followme.com


Hot
No comment on record. Start new comment.