- WTI benchmark snaps the previous day’s recovery moves from $37.26.
- Bearish MACD signals drag the quote towards an ascending trend line from May 13.
- Buyers may look for a sustained break above $40.00 for fresh entries.
WTI crude oil prices on NYMEX decline to $38.27 during the initial Asian session on Wednesday. The barrels of black gold recovered from $37.26 on Tuesday but failed to rise past-$38.55 on the daily closing basis.
Other than the energy benchmark’s failure to cross $38.55, bearish MACD also favors the odds of further downside towards the monthly support near $36.95.
Should the bears refrain from respecting the short-term key support line, May 26 high near $34.90 could offer intermediate halt ahead fetching the quote to sub-$31.00 area.
Meanwhile, $40.00 round-figure and the weekly high near $40.61 might keep the bulls away during the pair’s U-turn towards the north. Given the commodity prices rally past-$40.61, March 06 low near $41.22 could lure the bulls.
WTI four-hour chart
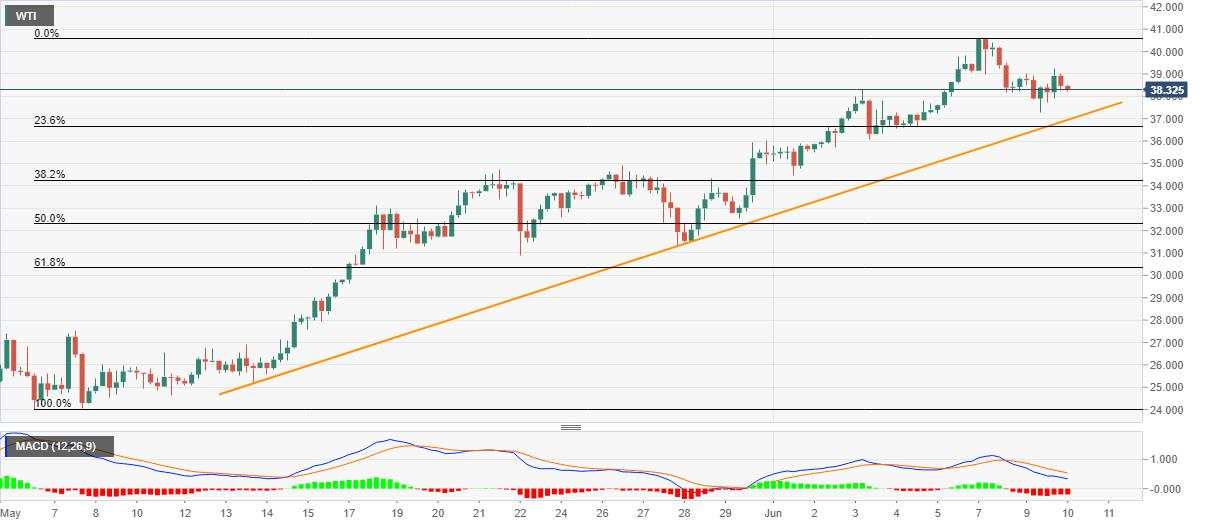
Trend: Further downside likely
Reprinted from FXStreet,the copyright all reserved by the original author.
Disclaimer: The views expressed are solely those of the author and do not represent the official position of Followme. Followme does not take responsibility for the accuracy, completeness, or reliability of the information provided and is not liable for any actions taken based on the content, unless explicitly stated in writing.

Leave Your Message Now