· Views 1,419
#FPMarkets澳福# #USD/CHF# #technicalanalysis# #Currencies#
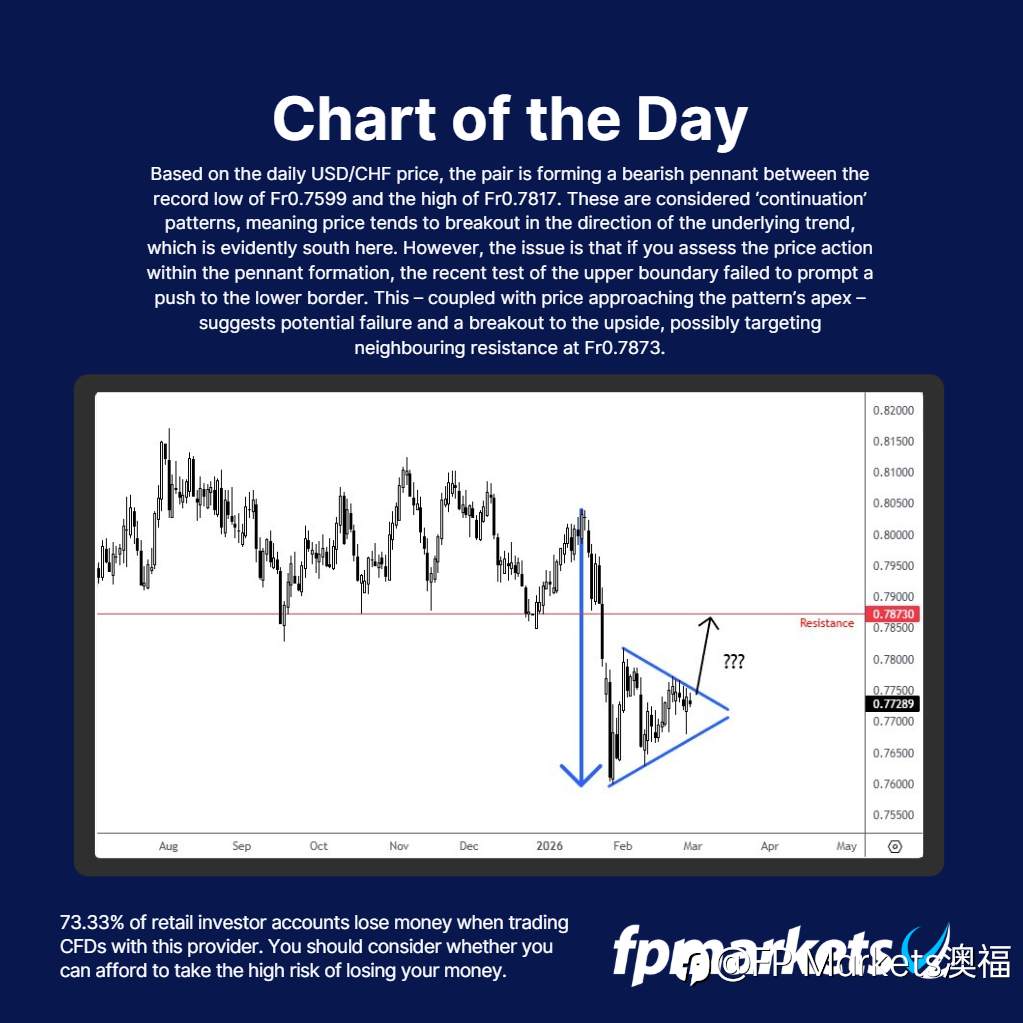
根据美元/瑞郎日线图,该货币对在0.7599瑞郎的历史低点和0.7817瑞郎的高点之间形成了一个看跌三角旗形。这些形态被认为是“持续”形态,意味着价格往往会沿着潜在趋势的方向突破,而目前的趋势显然是向下。然而,问题在于,如果分析三角旗形内部的价格走势,近期对上边界的测试未能促使价格向下突破。这一点,再加上价格接近形态顶点,表明该形态可能失败,并可能向上突破,目标位可能在0.7873瑞郎附近的阻力位。
Disclaimer: The views expressed are solely those of the author and do not represent the official position of Followme. Followme does not take responsibility for the accuracy, completeness, or reliability of the information provided and is not liable for any actions taken based on the content, unless explicitly stated in writing.
Like this article? Show your appreciation by sending a tip to the author.

Leave Your Message Now